Download
1 / 8
80 likes | 91 Views
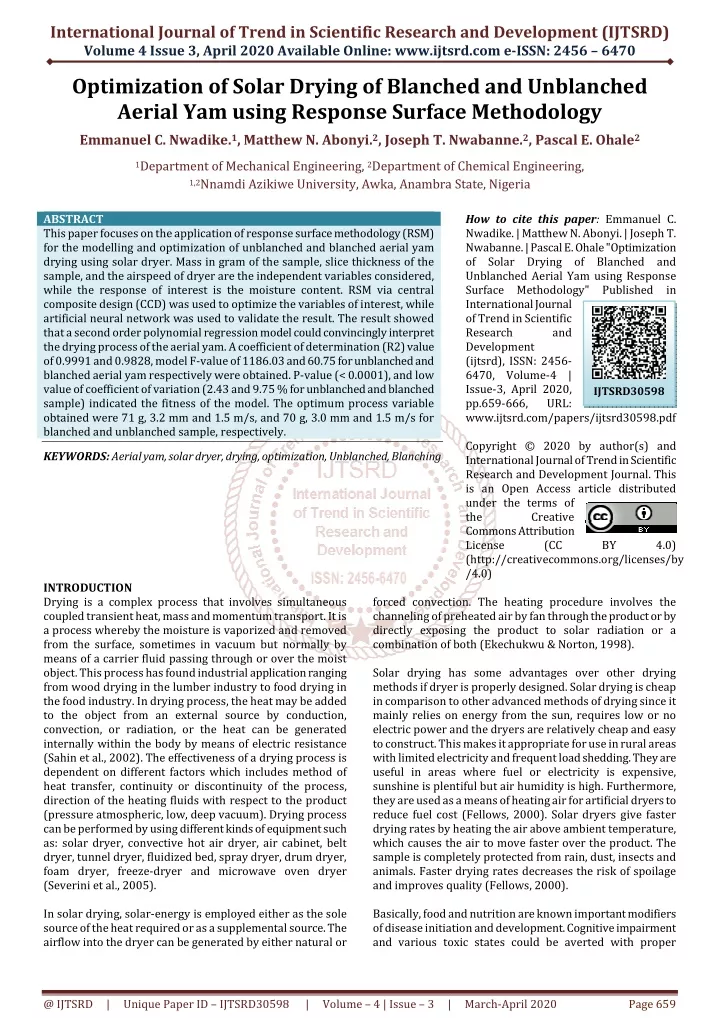
This paper focuses on the application of response surface methodology RSM for the modelling and optimization of unblanched and blanched aerial yam drying using solar dryer. Mass in gram of the sample, slice thickness of the sample, and the airspeed of dryer are the independent variables considered, while the response of interest is the moisture content. RSM via central composite design CCD was used to optimize the variables of interest, while artificial neural network was used to validate the result. The result showed that a second order polynomial regression model could convincingly interpret the drying process of the aerial yam. A coefficient of determination R2 value of 0.9991 and 0.9828, model F value of 1186.03 and 60.75 for unblanched and blanched aerial yam respectively were obtained. P value 0.0001 , and low value of coefficient of variation 2.43 and 9.75 for unblanched and blanched sample indicated the fitness of the model. The optimum process variable obtained were 71 g, 3.2 mm and 1.5 m s, and 70 g, 3.0 mm and 1.5 m s for blanched and unblanched sample, respectively. Emmanuel C. Nwadike. | Matthew N. Abonyi. | Joseph T. Nwabanne. | Pascal E. Ohale "Optimization of Solar Drying of Blanched and Unblanched Aerial Yam using Response Surface Methodology" Published in International Journal of Trend in Scientific Research and Development (ijtsrd), ISSN: 2456-6470, Volume-4 | Issue-3 , April 2020, URL: https://www.ijtsrd.com/papers/ijtsrd30598.pdf Paper Url :https://www.ijtsrd.com/engineering/mechanical-engineering/30598/optimization-of-solar-drying-of-blanched-and-unblanched-aerial-yam-using-response-surface-methodology/emmanuel-c-nwadike<br>

E N D
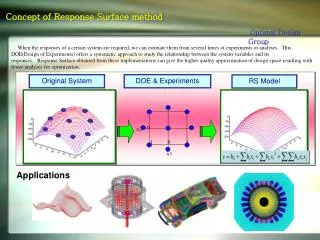
International Journal of Trend in Scientific Research and Development (IJTSRD) Volume 4 Issue 3, April 2020 Available Online: www.ijtsrd.com e-ISSN: 2456 – 6470 Optimization of Solar Drying of Blanched and Unblanched Aerial Yam using Response Surface Methodology Emmanuel C. Nwadike.1, Matthew N. Abonyi.2, Joseph T. Nwabanne.2, Pascal E. Ohale2 1Department of Mechanical Engineering, 2Department of Chemical Engineering, 1,2Nnamdi Azikiwe University, Awka, Anambra State, Nigeria ABSTRACT This paper focuses on the application of response surface methodology (RSM) for the modelling and optimization of unblanched and blanched aerial yam drying using solar dryer. Mass in gram of the sample, slice thickness of the sample, and the airspeed of dryer are the independent variables considered, while the response of interest is the moisture content. RSM via central composite design (CCD) was used to optimize the variables of interest, while artificial neural network was used to validate the result. The result showed that a second order polynomial regression model could convincingly interpret the drying process of the aerial yam. A coefficient of determination (R2) value of 0.9991 and 0.9828, model F-value of 1186.03 and 60.75 for unblanched and blanched aerial yam respectively were obtained. P-value (< 0.0001), and low value of coefficient of variation (2.43 and 9.75 % for unblanched and blanched sample) indicated the fitness of the model. The optimum process variable obtained were 71 g, 3.2 mm and 1.5 m/s, and 70 g, 3.0 mm and 1.5 m/s for blanched and unblanched sample, respectively. KEYWORDS: Aerial yam, solar dryer, drying, optimization, Unblanched, Blanching How to cite this paper: Emmanuel C. Nwadike. | Matthew N. Abonyi. | Joseph T. Nwabanne. | Pascal E. Ohale "Optimization of Solar Drying of Blanched and Unblanched Aerial Yam using Response Surface Methodology" Published in International Journal of Trend in Scientific Research and Development (ijtsrd), ISSN: 2456- 6470, Volume-4 | Issue-3, April 2020, pp.659-666, URL: www.ijtsrd.com/papers/ijtsrd30598.pdf Copyright © 2020 by author(s) and International Journal of Trend in Scientific Research and Development Journal. This is an Open Access article distributed under the terms of the Creative Commons Attribution License (CC (http://creativecommons.org/licenses/by /4.0) IJTSRD30598 BY 4.0) INTRODUCTION Drying is a complex process that involves simultaneous coupled transient heat, mass and momentum transport. It is a process whereby the moisture is vaporized and removed from the surface, sometimes in vacuum but normally by means of a carrier fluid passing through or over the moist object. This process has found industrial application ranging from wood drying in the lumber industry to food drying in the food industry. In drying process, the heat may be added to the object from an external source by conduction, convection, or radiation, or the heat can be generated internally within the body by means of electric resistance (Sahin et al., 2002). The effectiveness of a drying process is dependent on different factors which includes method of heat transfer, continuity or discontinuity of the process, direction of the heating fluids with respect to the product (pressure atmospheric, low, deep vacuum). Drying process can be performed by using different kinds of equipment such as: solar dryer, convective hot air dryer, air cabinet, belt dryer, tunnel dryer, fluidized bed, spray dryer, drum dryer, foam dryer, freeze-dryer and microwave oven dryer (Severini et al., 2005). In solar drying, solar-energy is employed either as the sole source of the heat required or as a supplemental source. The airflow into the dryer can be generated by either natural or forced convection. The heating procedure involves the channeling of preheated air by fan through the product or by directly exposing the product to solar radiation or a combination of both (Ekechukwu & Norton, 1998). Solar drying has some advantages over other drying methods if dryer is properly designed. Solar drying is cheap in comparison to other advanced methods of drying since it mainly relies on energy from the sun, requires low or no electric power and the dryers are relatively cheap and easy to construct. This makes it appropriate for use in rural areas with limited electricity and frequent load shedding. They are useful in areas where fuel or electricity is expensive, sunshine is plentiful but air humidity is high. Furthermore, they are used as a means of heating air for artificial dryers to reduce fuel cost (Fellows, 2000). Solar dryers give faster drying rates by heating the air above ambient temperature, which causes the air to move faster over the product. The sample is completely protected from rain, dust, insects and animals. Faster drying rates decreases the risk of spoilage and improves quality (Fellows, 2000). Basically, food and nutrition are known important modifiers of disease initiation and development. Cognitive impairment and various toxic states could be averted with proper @ IJTSRD | Unique Paper ID – IJTSRD30598 | Volume – 4 | Issue – 3 | March-April 2020 Page 659
International Journal of Trend in Scientific Research and Development (IJTSRD) @ www.ijtsrd.com eISSN: 2456-6470 nutrition and diet. Aerial yam is a good source of dietary supplement, Potassium, Sodium, Phosphorus, Calcium, Magnesium, Copper, Iron, Manganese, Zinc (Deb, 2002). It has a widespread health benefits including protection against development of cancer, osteoporosis, cardiovascular disease, nephritis, asthma, diabetes, and used in the preparation of contraceptives and in the treatment of various genetic disorders (Ayoola et. al., 2008). It also posses anti-inflammatory activities antimicrobial activity (Okigbo et al., 2009), cardio-protective activity (Vasanthi et al., 2010). Considering this widespread medical and economic benefit of aerial yam, efficient preservative techniques should be employed to make these agro-products available in the market. However, there is insufficient preservation facilities and the agro-materials are seasonal and are not available always throughout the year. Study on the drying of this yams using solar drying methods will provide information for the design and operation of the dryers. Drying of the materials is necessary to understand the fundamental transport mechanism and a prerequisite to successfully simulate or scale up whole process for optimization or control of the operating conditions. Hence, the researched is aimed at the optimization of the drying process of aerial yam using response surface methodology. Optimization of the drying process is very important because this will provide sufficient information that will help in the design of processing equipment for postharvest processing of aerial yam. TABLE 1: EXPERIMENTAL RANGE AND LEVELS OF THE INDEPENDENT VARIABLES FOR AERIAL YAM DRYING Variables codes Codes - Variables -1 Level 0 Airspeed(rpm) X1 1.1339 Slice thickness(mm) X2 1.2679 Mass (g) X3 59.0192 Solar drying Following Fauziah et al., (2013) methods, the experiments were conducted by employing the conditions listed in Tables 2. The sample was cut to 2.0 mm size and 100g each of the samples weighed with electronic weighing scale (Model TDUB-63V09) and placed into the solar dryer tray (Fig. 1). The airspeed was set at 0.5 m/s using anemometer. The sample was dried for 4 hours and the loss in weight was recorded at an interval of 5, 10, 20, 30, 60, 90… mins. Hygro-thermometer (Model TH029) was used to measure the wet and dry bulb temperatures of the surrounding as well as the relative humidity of the surrounding. The experiments were repeated for different airspeed, mass of sample and sizes of samples. Thereafter, the moisture content of the sample on dry basis was calculated using equation 1. (1) Materials and Methods The aerial yam was collected from Afor Opi market (Long. 7.4332oE and Lat. 6.7822o N) in Nsukka local government area of Enugu state. It was identified at crop science department of Nnamdi Azikiwe University, Awka. Thereafter, it was washed with clean water and spread in open air to avoid spoilage. Experimental Design In this study, RSM via central composite design (CCD) was utilized for the experimental design of the drying process. CCD was chosen since it could eliminate the time consuming stage which cannot be achieved using one-factor-at-a-time approach. Moreover, the CCD is well suited for fitting a quadratic surface, which commonly works well for the process optimization, and it involves a minimum number of experiments to be carried out. By using CCD, linear, quadratic, cubic and cross-product effects of operating condition on the drying efficiency (moisture contents) was investigated. The air speed, mass of sample and the slice thickness are identified as the set of three independent process variables for solar dryer. The influence of these independent variables on the output variable (moisture content) were investigated. The CCD method was adopted to decide the number of experiments to be performed for optimization of the process variables. Design Expert Version.11.0.3 software was used to optimize the drying process. Table 1 shows the experimental range and levels of the independent variables. (Omodamiro., 2015), +1 2.866 4.73205 4 4.73205 100 110.981 +2 2 2 70 3 2 85 Where; MC is the moisture content of the sample after drying, M1 is the initial mass before drying and M2 is the mass after drying. Table 2 is the The CCD matrix along with the experimental responses for aerial yam drying using solar dryer. FIG 1: A SCHEMATIC DIAGRAM OF SOLAR DRYER USED @ IJTSRD | Unique Paper ID – IJTSRD30598 | Volume – 4 | Issue – 3 | March-April 2020 Page 660
International Journal of Trend in Scientific Research and Development (IJTSRD) @ www.ijtsrd.com eISSN: 2456-6470 Blanching of the Samples This experiment was carried out at the Chemical Engineering laboratory, Nnamdi Azikiwe University Awka. In blanching, 2.0 mm of the sample was cut and 100g of the sample weighed into a bowel containing boiled water at 80oC. The sample was left in the hot water for 10 minutes. The water was removed and the new weight of the sample taken. The sample was put in the solar dryer and allowed to dry for 4 hours and the weight was taken at interval as done with unblanched samples. TABLE 2 - THE CCD MATRIX ALONG WITH THE EXPERIMENTAL RESPONSES FOR AERIAL YAM DRYING USING SOLAR DRYING Run No. Airspeed (m/s) Thickness(mm) Mass (g) M.C for unblanched A.Y M.C for Blanched A.Y 1 1.5 2 70 2 2.5 2 70 3 1.5 4 70 4 2.5 4 70 5 1.5 2 100 6 2.5 2 100 7 1.5 4 100 8 2.5 4 100 9 1.1 3 85 10 2.9 3 85 11 2 1 85 12 2 5 85 13 2 3 59 14 2 3 111 15 2 3 85 16 2 3 85 17 2 3 85 18 2 3 85 19 2 3 85 20 2 3 85 Artificial Neural Network The optimization process was validated with artificial neural network (ANN). A total of 12 (60%) of experimental results were used to train the network, 5 (25%) of the experimental result was used to validate the training while the remaining 3 (15%) was used for testing. After the selection of the hidden number of neurons, a number of trainings runs were performed to look out for the best possible weights in error back propagation framework. The architectural framework of the ANN for solar dryer is shown in Fig. 2.while the schematic diagram of the whole process is shown in Fig. 3. 11.09 41.21 20.24 58.7 19.52 67.06 58.41 85.36 17.01 56.23 32.81 38.24 18.00 45.71 55.06 55.15 57.65 55.06 55.06 56.05 10.66 38.03 13.03 43.51 18.19 32.6 42.79 43.44 32.39 30.19 29.75 30.59 14.13 55.66 37.71 45.52 46.66 47.68 48.66 47.61 FIG 3: ANN SCHEMATIC DIAGRAM Results and Discussion Development of Model Equation The multiple regression analysis was used in this optimization of blanched and unblanched aerial yam drying to correlate the responses (moisture content) with the three variables considered using a second order polynomial equation. Model reduction was used to eliminate insignificant model terms for better prediction accuracy. The selected model in terms of the actual values as suggested by the software were given by eqns. (1) and (2) for unblanched and blanched aerial yam respectively. FIGURE 2: ANN FRAME WORK OF SOLAR DRYER @ IJTSRD | Unique Paper ID – IJTSRD30598 | Volume – 4 | Issue – 3 | March-April 2020 Page 661
International Journal of Trend in Scientific Research and Development (IJTSRD) @ www.ijtsrd.com eISSN: 2456-6470 M.C for unblanched A.Y = -235.357 - 94.213X1 + 58.785X2 + 5.175X3 + 4.311X1X2 + 1.242X1X3 - 0.313X2X3 + 7.222X12 - 6.654X22 - 0.0363X32 M.C for blanched A.Y = 117.0176 - 111.497X1 - 84.239X2 + 2.341X3 + 19.756X1X2 + 0.412X1X3- 0.083X2X3 + 15.682X12 + 8.243X22- 0.015X32 Statistical Analysis Lack-of-fit test was applied in weighing the fitness of the generated models based on response surface analysis (Lee et al., 2006). This test compares the variation around the model with pure variation within replicated observations. Tables 3 and 4 show that there was a significant difference of lack of fit for Linear and 2FI models for the unblanched and blanched samples. However, the test was not significant in quadratic model. The significant results of lack of fit show that the linear and 2FI model are not adequate for use in response prediction. The R-squared, adjusted R-squared and the predicted R-squared values for the quadratic models show a high value of R2> 0.95 when compared to other models. The measure of how efficient the variability in the actual response values can be explained by the experimental variables and their interactions is given by the R-Squared value. The higher the R2 value, the better the model in predicting the response. Adjusted-R2 is a measure of the amount of variation around the mean explained by the model adjusted for the number of terms in the model. The adjusted-R2 decreases as the number of terms in the model increases, if those additional terms do not add value to the model. Predicted-R2 is a measure of the amount of variation in new data explained by the model. The predicted-R2 and the adjusted-R2 should be within 0.20 of each other, Otherwise there may be a problem with either the data or the model, (Taran and Aghaie, 2015). Based on these results, the effect of each parameter was evaluated using quadratic model as shown on ANOVA for response surface quadratic model (Tables 5 and 6). The coefficient of determination (R2), the adjusted determination coefficient (Adj R-Squared), the predicted -R2 and coefficient of variance (CV) were used to weigh the adequacy of the model (Chen et al., 2010; Wang et al., 2007). The high regression values associated with these terms show that the produced models are easily reproducible with negligible errors. The results obtained from the coefficient of variance (CV) indicates that all values are <10%, which certifies the reproducibility. The f value is used to measure the contribution of each term to the overall model output and performance. The low f- value for lack of fit depicts its insignificance relative to pure error. Non-significant lack of fit is desirable because it means the model will produce a good fit. The f-value for the effect of air speed shows that it has the highest effect on the overall performance of the solar drying process. (2) (3) TABLE 3 - LACK OF FIT TABLE FOR THE SOLAR DRYING OF AERIAL YAM Sequ. p-value Lack of Fit p-value Adjusted R-Squared Predicted R-Squared < 0.0001 < 0.0001 0.1285 < 0.0001 Quadratic < 0.0001 0.3878 Cubic 0.871 0.0838 Source Linear 2FI 0.7549 0.8021 0.9982 0.9975 0.6487 0.6995 0.9954 0.9177 TABLE 4 - LACK OF FIT TABLE FOR THE SOLAR DRYING OF AERIAL YAM Source Std. Dev. R-Squared Adjusted R-Squared Predicted R-Squared Linear 13.01 0.7343 2FI 11.73 0.8245 Quadratic 4.28 0.982 Cubic 4.21 0.9896 0.6845 0.7435 0.9659 0.9669 0.5322 0.6754 0.8932 -0.2231 TABLE 5: ANOVA FOR RESPONSE SURFACE REDUCED QUADRATIC MODEL FOR MOISTURE REMOVAL FROM UNBLANCHED AERIAL YAM. Source Sum of Squares df Mean Square Model 13429.87 9 1492.21 X1-Air speed 9654.44 1 9654.44 X2-Thickness 33.11 1 33.11 X3-Mass 980.14 1 980.14 X1X2 39.38 1 39.38 X1X3 720.29 1 720.29 X2X3 194.54 1 194.54 X12 48.51 1 48.51 X22 739.99 1 739.99 X32 1073.84 1 1073.84 Residual 12.58 10 1.26 Lack of Fit 7.13 5 1.43 Pure Error 5.45 5 1.09 Cor Total 13442.45 19 Std. Dev. 1.12 Mean 46.23 C.V. % 2.43 PRESS 62.22 -2 Log Likelihood 47.49 F Value 1186.03 7673.47 26.32 779.03 31.3 572.5 154.62 38.56 588.15 853.5 1.31 p-value Prob > F < 0.0001 < 0.0001 0.0004 < 0.0001 0.0002 < 0.0001 < 0.0001 0.0001 < 0.0001 < 0.0001 0.3878 R-Squared Adj R-Squared Pred R-Squared Adeq Precision BIC significant not significant 0.9991 0.9982 0.9954 122.397 77.44 @ IJTSRD | Unique Paper ID – IJTSRD30598 | Volume – 4 | Issue – 3 | March-April 2020 Page 662
International Journal of Trend in Scientific Research and Development (IJTSRD) @ www.ijtsrd.com eISSN: 2456-6470 TABLE 6: ANOVA FOR RESPONSE SURFACE REDUCED QUADRATIC MODEL FOR MOISTURE REMOVAL FROM BLANCHED AERIAL YAM Source Sum of Squares Df Mean Square F Value p-value Prob> F Model 10015.48 9 1112.83 X1-Air speed 6841.82 1 6841.82 X2-Thickness 142.3 1 142.3 X3-Mass 504.65 1 504.65 X1X2 827.23 1 827.23 X1X3 79.44 1 79.44 X2X3 13.55 1 13.55 X12 228.77 1 228.77 X22 1135.75 1 1135.75 X32 179.27 1 179.27 Residual 183.17 10 18.32 Lack of Fit 133.76 5 26.75 Pure Error 49.41 5 9.88 Cor Total 10198.65 19 Std. Dev. 4.28 Mean 43.89 C.V. % 9.75 PRESS 1088.73 -2 Log Likelihood 101.05 60.75 373.52 7.77 27.55 45.16 4.34 0.74 12.49 62.01 9.79 2.71 < 0.0001 < 0.0001 0.0192 0.0004 < 0.0001 0.0639 0.41 0.0054 < 0.0001 0.0107 0.1492 significant not significant 0.9828 0.9659 0.8932 25.539 131.01 R-Squared Adj R-Squared Pred R-Squared Adeq Precision BIC Residual Analysis The plot of the actual response values against the predicted response values is used to detect a value, or group of values that are not easily predicted by the model under consideration. The data points should be divided equally by the 45 degree line. Figs. 4 and 5 show the predicted versus actual plot for solar drying of unblanched and blanched aerial yam. The points on the plots were evenly distributed, indicating a good agreement between the experimental and predicted response values. The values of R2 and adjusted R2 were evaluated as 0.9991 and 0.9982 for unblanched and blanched samples respectively. These values showed a very good agreement between the predicted and actual data. Since the points on the plots were closely distributed to the straight line of the plot, it confirms the good relationship between the actual values and the predicted values of the response. This plots also confirmed that the selected model was adequate in predicting the response variables in the experimental values. FIGURE5. PREDICTED VS. ACTUAL PLOT FOR BLANCHED AERIAL YAM DRYING The Three Dimensional (3-D) response surface plot The results of all process parameters are presented in Figs. 6-9 using 3D surface. The responses and the graphical representations were generated from the experimental quadratic models (eqs. 2 and 3). The statistical and data analyses show that the thickness and air drying velocity have a very significant effects (p < 0.02) on the moisture content. The moisture removal is accelerated with increase in drying air velocity. This effect did not display any quadratic character throughout the study. The effect of material thickness showed different trend. Increasing the sample thickness from 2-3 mm resulted in improved removal of moisture. However, sample thickness beyond 3mm declined the rate of moisture content removal as seen in Fig. 6. The increase in moisture removal resulting from increase in air drying velocity is as a result of rapid movement of dry air molecules across the drying chamber. Figure 8 shows that there was an enhanced rate of moisture removal between 70 g - 90 g mass. Beyond 90 g, the rate of moisture removal attained equilibrium and produced a negligible amount of FIGURE4. PREDICTED VS. ACTUAL PLOT FOR UNBLANCHED AERIAL YAM DRYING @ IJTSRD | Unique Paper ID – IJTSRD30598 | Volume – 4 | Issue – 3 | March-April 2020 Page 663
International Journal of Trend in Scientific Research and Development (IJTSRD) @ www.ijtsrd.com eISSN: 2456-6470 moisture loss when compared to the result obtained for 100 g mass sample. The optimum operating points for both the unblanched and blanched aerial yam sample are given in Table 7. Airspeed (m/s) FIGURE 9:3D SURFACE PLOT FOR THE EFFECT OF MASS OF SAMPLE AND AIR SPEED ON MOISTURE CONTENT OF BLANCHED AY USING SOLAR DRYING TABLE 7: TABLE OF OPTIMAL PARAMETERS Mass (g) (mm) Blanched 71 3.2mm Unblanched 70 3.0mm Thickness Air speed (m/s) 1.5 1.5 MC for AY (%) 12.3 18.0 Samples FIGURE 6:- 3D SURFACE PLOT FOR THE EFFECT OF SLICE THICKNESS AND AIR VELOCITY ON MOISTURE CONTENT OF UNBLANCHED AY USING SOLAR DRYING Comparison of RSM and ANN In order to validate the nonlinear nature of the present system and to assess the superiority of either technique in capturing the quadratic nature, a couple of methods were applied. These include; 1.Absolute average relative deviation (AARD) observed for both models; 2.Coefficient of determination for both models. The AARD observed for both models give an indication of how accurate the model predictions can be. (Josh et al., 2014). AARD (%) = (4) where n is the number of sample points, Rart,pred the predicted value and Rart,exp the experimentally determined value. (Josh et al., 2014). The results of this analysis are tabulated in Table 8. The model comparison and appraisal plots are displayed on Figures 10 to 13 for both unblanched and blanched samples. Although the results of the RSM and ANN are in reasonable agreement (validating the quadratic nature of the present system), the AARD and regression coefficient (R-SQRD) values suggest that the ANN performed better in capturing the nonlinearity of the system than the RSM. However, RSM performed better in data prediction accuracy for all blanched aerial yam specie. TABLE 9: SOLAR DRYING PARAMETERS FOR MODEL COMPARISON Regression Coefficient (R-SQURD) ANN RSM Blanched Aerial Yam Unblanched Aerial Yam FIGURE 7:3D SURFACE PLOT FOR THE EFFECT OF SLICE THICKNESS AND AIR VELOCITY ON MOISTURE CONTENT OF BLANCHED AY USING SOLAR DRYING Absolute Average Relative Deviation (%) ANN Sample RSM 0.976 0.982 8.62 9.59 FIGURE 8:3D SURFACE PLOT FOR THE EFFECT OF MASS OF SAMPLE AND AIR SPEED ON MOISTURE CONTENT OF UNBLANCHED AY USING SOLAR DRYING 0.994 0.994 2.17 4.49 @ IJTSRD | Unique Paper ID – IJTSRD30598 | Volume – 4 | Issue – 3 | March-April 2020 Page 664
International Journal of Trend in Scientific Research and Development (IJTSRD) @ www.ijtsrd.com eISSN: 2456-6470 FIGURE 10: RSM AND ANN COMPARATIVE PARITY PLOT FOR THE SOLAR DRYING OF BLANCHED AERIAL YAM. FIGURE 13: RSM AND ANN MODEL APPRAISAL PLOT FOR THE SOLAR DRYING OF UNBLANCHED AERIAL YAM Conclusion Regression model equation was successfully developed to efficiently predict quality parameters of a solar drying of aerial yam at any given drying time. The model’s Good fit were justified with the non-significant lack of fit (p > 0.05) and relatively high values of regression coefficient. The high regression values associated with these terms show that the produced models are easily reproducible with negligible errors. The residual plots also confirmed that the selected model was adequate in predicting the response variables in the experimental values. The drying conditions of 3.2 mm thickness of aerial yam sample, 71 g mass of sample and 1.5 m/s airspeed were determined as the desirable optimized conditions for the blanched sample. The optimized drying conditions obtained for the unblanched sample were 70 g, 3.0 mm and 1.5 m/s for mass, slice thickness and airspeed respectively. Hence the optimum drying conditions obtained in this study could be employed as a standard information for the design of industrial processing equipment of the yam. References [1]Ayoola, G. A., Coker, H. A. B., Adesegun, S. A., Adepoju- Bello, A. A., Obaweya, K., & Ezennia, E. C. (2008). Phytochemical Screening and antioxidant activities of some Selected Medicinal Plant used for malaria therapy in South-western Nigeria. Tropical Journal of Pharmaceutical Research, 7(3):1019-1014. FIGURE 11: RSM AND ANN MODEL APPRAISAL PLOT FOR THE SOLAR DRYING OF BLANCHED AERIAL YAM. [2]Chen, G., Xiong, K., Peng. J., & Chen, J. (2010). Optimization of combined mechanical activation roasting parameters of titania slag using response surface methodology. Advanced powder technology, 21(3), 331-335. [3]Deb, A. C. (2002). Fundamental of Biochemistry. Eds 8, New Central Book Agency, Kolkata. [4]Dike, V. N., Chineke, T. C., Nwofor, O. K., & Okoro, U. K. (2011). Evaluation of horizontal surface solar radiation levels in southern Nigeria. Journal of Renewable and Sustainable Energy. 3, 023101. FIGURE 12: RSM AND ANN COMPARATIVE PARITY PLOT FOR THE SOLAR DRYING OF UNBLANCHED AERIAL YAM. [5]Ekechukwu, O. V., & Norton, B. (1998). Review of solar- energy drying systems III: low temperature air-heating solar collectors for crop drying applications. Energy Conversion and Management, 1999. 40:657–67. @ IJTSRD | Unique Paper ID – IJTSRD30598 | Volume – 4 | Issue – 3 | March-April 2020 Page 665
International Journal of Trend in Scientific Research and Development (IJTSRD) @ www.ijtsrd.com eISSN: 2456-6470 [6]Fauziah, S., Nurhayati, A., & Zalila, A, (2013). Solar Drying System for Drying Empty Fruit Bunches. Journal of Physical Science, Vol. 24(1), 75–93. [12]Sahin A. Z., Dincer I., Yilbas, B. S. & Hussain M. M. (2002). Determination of drying times for regular multi-dimensional objects. International Journal of Heat and Mass Transfer, 45, pp. 1757– 1766. [7]Fellows, J. P. (2000). Food Processing Technology, Principles and Practice 2nd Edition. CRC Press, Woodhead Publishing Limited. [13]Severini C., Baiano A., Pilli T. De, Carbone B. F., & Derossi A. (2005). Combined treatments of blanching and dehydration: study on potato cubes. Journal of Food Engineering, 68(3), pp. 289–296. [8]Josh, P., Chris, P., Rachel, L., & Gomes, M. (2014). Comparison of response surface methodology (RSM) and artificial neural networks (ANN) towards efficient extraction of artemisinin from artemisia annua. Industrial crops and products, 58, 15–24. [14]Taran, M., & Aghaie, E., (2015). Designing and optimization of separation process of iron impurities from kaolin by oxalic acid in bench-scale stirred-tank reactor. Applied clay science, 107, 109-116. [9]Lee, C., Yusof, S., Hamid, A., & Baharin, B. (2006). Optimizing conditions for hot water extraction of banana juice using response surface methodology (RSM). Journal of food engineering, 75, 473-479. [15]Vasanthi, H.R., Mukherjee, S., Ray, D., Jayachandra, K.S.P., & Lekli., (2010). Protective role of air potato (dioscorea bulbifera) of yam family in myocardial ischemic reperfusion injury, food funct.1:278-283. [10]Okigbo, R.N., Anuagasi, C.L., Amadi, J.E., & Ukpabi, U.J. (2009). Potential inhibitory effects of some African tuberous plant extracts on Escherichia coli, Staphylococcus aureus International journal of green boil, 6:91-98. [16]Wang, S., Chen, F., Wu, J., Wang, Z., Liao, X., & Hu, X. (2007). Optimization of pectin extraction assisted by microwave from apple performance using response surface methodology. Journal of food engineering, 78, 693-700. and Candida albicans. [11]Omodamiro, O.D. (2015). Anti-inflammatory and diuretic activities of ethanol extract of Dioscorea bulbifera leaf. AJDDT, 2(1): 029-038. @ IJTSRD | Unique Paper ID – IJTSRD30598 | Volume – 4 | Issue – 3 | March-April 2020 Page 666