Download
1 / 5
60 likes | 75 Views
Based on a Box- Behnken design,response surface methodology was used to optimize the effects of processing<br>parameters of extraction from Scutellaria barbata on total alkaloids yield. Three independent variables such as<br>extraction time (X1), liquid-solid ratio (X2) and ultrasonic frequency (X3) were study. The P-value indicated that<br>both extraction time (X1) and ultrasonic frequency (X3) had significant effects on the response value, followed by the<br>interaction effects of liquid-solid ratio and ultrasonic frequency (X2X3). It also indicated that the square effects of<br>extraction time (X1<br>2<br>), liquid-solid ratio ( X2<br>2<br>) and ultrasonic frequency (X3<br>2<br>) had significant effects on the yields of<br>alkaloids from Scutellaria barbata D. Don. The optimum conditions of alkaloids extraction were extraction time of<br>60 min, liquid-solid ratio of 55 mL/g and ultrasonic frequency of 350w. Under optimized conditions, the<br>experimental yield 1.39±0.061% agreed closely with the predicted yield (1.40%).

E N D
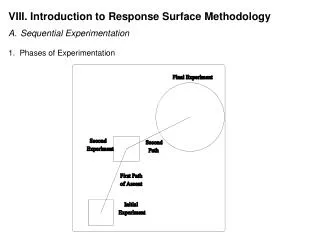
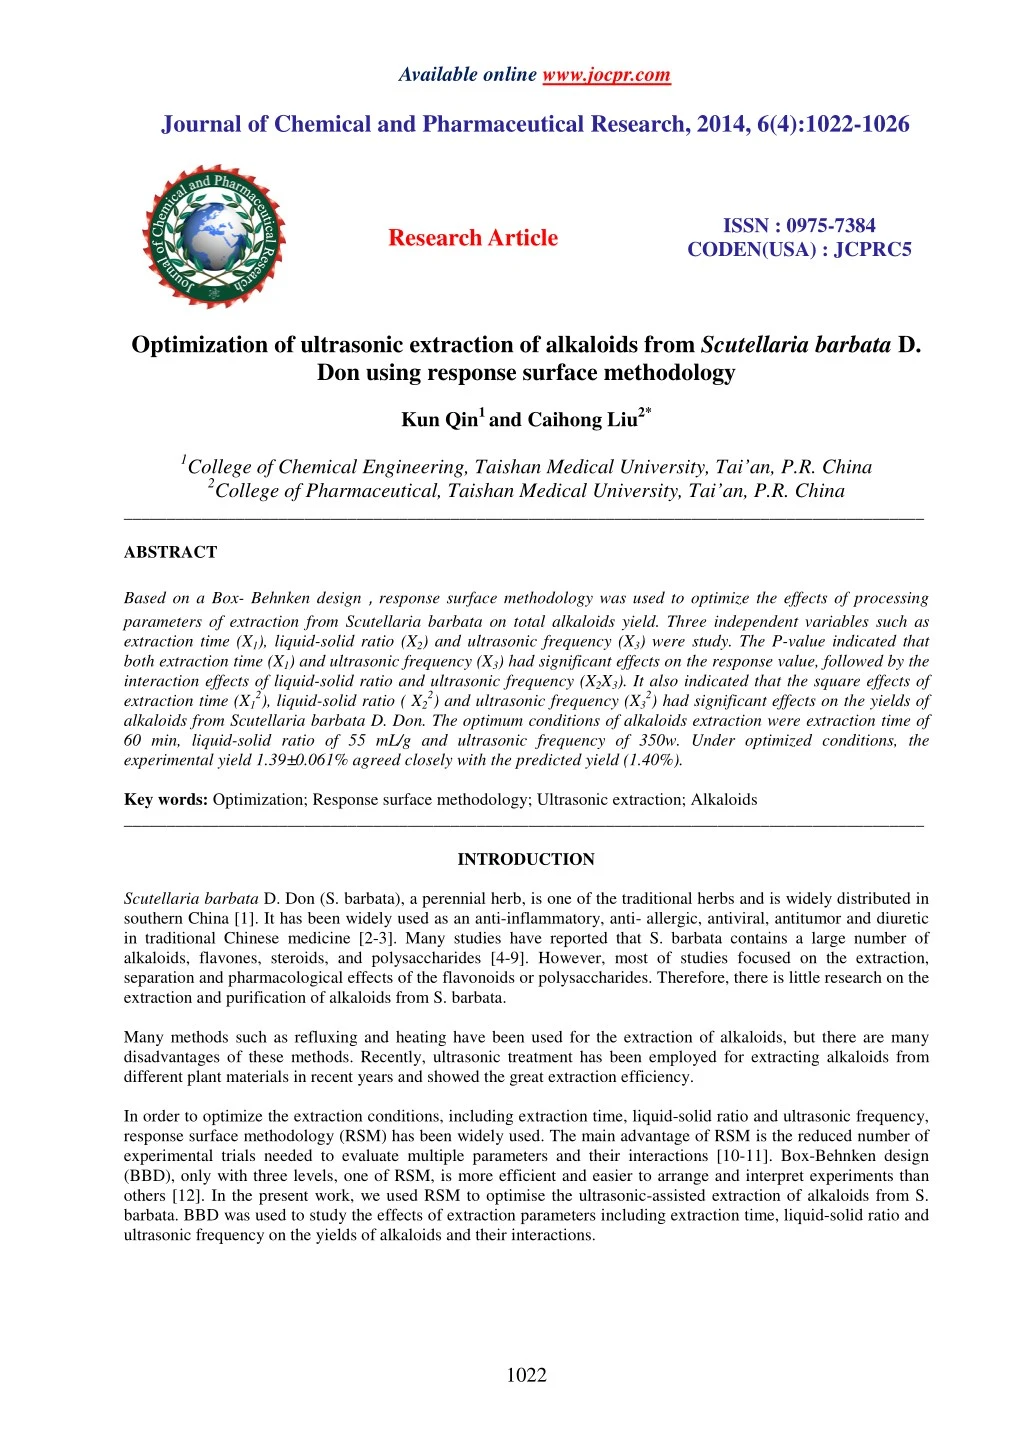
Available online www.jocpr.com Journal of Chemical and Pharmaceutical Research, 2014, 6(4):1022-1026 ISSN : 0975-7384 CODEN(USA) : JCPRC5 Research Article Optimization of ultrasonic extraction of alkaloids from Scutellaria barbata D. Don using response surface methodology Kun Qin1 and Caihong Liu2* 1College of Chemical Engineering, Taishan Medical University, Tai’an, P.R. China 2College of Pharmaceutical, Taishan Medical University, Tai’an, P.R. China _____________________________________________________________________________________________ ABSTRACT Based on a Box- Behnken design,response surface methodology was used to optimize the effects of processing parameters of extraction from Scutellaria barbata on total alkaloids yield. Three independent variables such as extraction time (X1), liquid-solid ratio (X2) and ultrasonic frequency (X3) were study. The P-value indicated that both extraction time (X1) and ultrasonic frequency (X3) had significant effects on the response value, followed by the interaction effects of liquid-solid ratio and ultrasonic frequency (X2X3). It also indicated that the square effects of extraction time (X1 alkaloids from Scutellaria barbata D. Don. The optimum conditions of alkaloids extraction were extraction time of 60 min, liquid-solid ratio of 55 mL/g and ultrasonic frequency of 350w. Under optimized conditions, the experimental yield 1.39±0.061% agreed closely with the predicted yield (1.40%). Key words: Optimization; Response surface methodology; Ultrasonic extraction; Alkaloids _____________________________________________________________________________________________ INTRODUCTION Scutellaria barbata D. Don (S. barbata), a perennial herb, is one of the traditional herbs and is widely distributed in southern China [1]. It has been widely used as an anti-inflammatory, anti- allergic, antiviral, antitumor and diuretic in traditional Chinese medicine [2-3]. Many studies have reported that S. barbata contains a large number of alkaloids, flavones, steroids, and polysaccharides [4-9]. However, most of studies focused on the extraction, separation and pharmacological effects of the flavonoids or polysaccharides. Therefore, there is little research on the extraction and purification of alkaloids from S. barbata. Many methods such as refluxing and heating have been used for the extraction of alkaloids, but there are many disadvantages of these methods. Recently, ultrasonic treatment has been employed for extracting alkaloids from different plant materials in recent years and showed the great extraction efficiency. In order to optimize the extraction conditions, including extraction time, liquid-solid ratio and ultrasonic frequency, response surface methodology (RSM) has been widely used. The main advantage of RSM is the reduced number of experimental trials needed to evaluate multiple parameters and their interactions [10-11]. Box-Behnken design (BBD), only with three levels, one of RSM, is more efficient and easier to arrange and interpret experiments than others [12]. In the present work, we used RSM to optimise the ultrasonic-assisted extraction of alkaloids from S. barbata. BBD was used to study the effects of extraction parameters including extraction time, liquid-solid ratio and ultrasonic frequency on the yields of alkaloids and their interactions. 2), liquid-solid ratio ( X2 2) and ultrasonic frequency (X3 2) had significant effects on the yields of 1022
Kun Qinand Caihong Liu J. Chem. Pharm. Res., 2014, 6(4):1022-1026 _____________________________________________________________________________ EXPERIMENTAL SECTION 2.1 Materials and chemicals The dried S. barbata was purchased from Tai’an Pharmacy in Shandong Province, China. Berberine hydrochloride was purchased from China Food and Drug Administration. Other chemicals and solvents were of analytical grade and purchased from Beijing Chemicals Co., Ltd, China. Water was prepared doubly distilled. Ultrasonic cleaner (SB5200DTD, Kun Shan Ultrasonic Instruments Co., Ltd, Jiangsu, China) was used for ultrasonic extraction of alkaloids, UV-1700 spectrophotometer (Shimadzu Corporation, Japan) was used for total alkaloids analysis of sample. 2.2 Extraction of total alkaloids The extraction was performed in a conical flask with cover by ultrasonic treatment. The samples were extracted for different time at varied ultrasonic power, with 55% ethanol, at 70℃. One gram of dried S. barbata powders (20 mesh) was used for each treatment. The extracted slurry was centrifuged at 4000 rpm/min for 20 min to collect the supernatant, and the insoluble residue was treated again as mentioned above. The supernatant was incorporated and collected for the content of total alkaloids. 2.3 Determining content of alkaloids The total alkaloids content was determined using a UV-VIS method. Briefly, 2mL of the sample solution was evaporated to dryness and then dissolved by methanol- hydrochloric acid (100:1). The supernatant was filled into a volumetric flask (25 mL), for the determination of alkaloids. The mixture was allowed to stand for 5 min and the absorption was measured at 348 nm against the same mixture, without the sample as a blank. The content of the total alkaloids was expressed as berberine hydrochloride equivalents (mg berberine hydrochloride/g sample) through the calibration curve of berberine hydrochloride. 2.4 Determination of alkaloids yield The percentage alkaloids yield (%) is calculated as the alkaloids content of extraction divided by dried sample weight. 2.5 Experimental design and statistical analysis BBD was applied to determine the optimum condition of ultrasonic extraction of alkaloids from S. barbata. Depending on the results of single-factor experiment for the alkaloids production, 3 extraction variables X1 (extraction time), X2 (liquid-solid ratio) and X3 (ultrasonic frequency) at 3 variable levels in the extraction process, is showed in Table 1. The coded and actual values are also shown in Table 1. A total of seventeen combinations (Table 2) augmented with five replications (treatment 13-17) were carried out at the center of the design to evaluate the pure error sum of squares. The triplicates were performed at all design points in randomized order. Alkaloids yield (Y) was taken as the response of the design experiments. These values were related to the coded variables by a second-order polynomial Eq. (1) below: n n n x x x x ∑ ∑ ∑ = = < = (1) where Y is the response (dependent variables), β0, βi, βii and βij represent the regression coefficient, and xi and xj are the independent variables. The significance of each coefficient was determined by F-test and P-value. The behavior of the surface was investigated for the response function (Y) using the regression equation. The fitted polynomial equation was expressed as surface and contour plots in order to visualize the relationship between the response and experimental levels of each factor and to deduce the optimal conditions [13]. Table 1 Factors and levels Factors Extraction time (min, X1) -1(40) Liquid: solid (mL/g, X2) -1(35) Ultrasonic power (w, X3) -1(300) Υ = β + β + β + β 2 0 i i ij i j ii i 1 2 1 i i j i Low Center 0(50) 0(50) 0(350) High +1(60) +1 (65) +1 (400) 1023
Kun Qinand Caihong Liu J. Chem. Pharm. Res., 2014, 6(4):1022-1026 _____________________________________________________________________________ Table 2 Box-Behnken experimental design with the independent variables Coded variable levels X1 X2 X3 Actual values Predicted values 1 -1 -1 0 2 1 -1 0 3 -1 1 0 4 1 1 0 5 -1 0 -1 6 1 0 -1 7 -1 0 1 8 1 0 1 9 0 -1 -1 10 0 1 -1 11 0 -1 1 12 0 1 1 13 0 0 0 14 0 0 0 15 0 0 0 16 0 0 0 17 0 0 0 RESULTS AND DISCUSSION Yield (%) Run 1.04 1.28 1.03 1.40 1.06 1.26 0.91 1.23 1.06 1.17 1.13 1.05 1. 31 1.31 1.31 1.31 1.31 1.06 1.28 1.03 1.37 1.03 1.25 0.92 1.26 1.06 1.20 1.11 1.04 1.31 1.31 1.31 1.31 1.31 3.1 Fitting the model A regression analysis in Table 3 was carried out to fit mathematical models to the experimental data, aiming at an optimal region for the studied. The regression equation in coded unit for predicting yield(Y) was given in Eq. (2): Y = 1.31+0.14X1+0.017 X2-0.028 X3+0.031 X1 X2+0.030 X1X3-0.048 X2 X3-0.056X1 where X1, X2 and X3 represent extraction time, liquid-solid ratio and ultrasonic power, respectively. Table 3 Analysis of variance for the fitted quadratic polynomial model of extraction of alkaloids Source SS DF Model 0.31 9 Residual 4.123×10⁻³ 7 5.890×10⁻⁴ Lack of fit 4.120×10⁻³ 3 1.373×10⁻³ Pure error 3.2×10⁻⁶ 4 Cor Total 0.31 16 R²=0.9869 CV=2.05 Analysis of variance was performed by ANOVA procedure. P-value < 0.05 were regarded as significant and P-value < 0.01 as very significant. As shown in Table 3, the model F-value of 58.57 and P-value (p < 0.0001) implies the model is significant [14]. The R2 of 0.9869 for the predicted mode indicated that the response model could explain 98.69% of the total variations, suggesting the goodness of fit of the mode [15]. The R2 significance of this model. The value of CV shows a better precision and reliability of the experiments. The P-value was used to check the significance of model terms and P <0.0500 indicate model terms are significant. As shown in Table 4, X1, X3, X1X2, X2X3, X1X3, X1 Table 4 Estimated regression model of relationship between response Variables (yield of alkaloids) and independent variables (X1, X2, X3) Variables SS DF X1 0.16 1 X2 2.346×10⁻³ 1 2.346×10-3 X3 6.216×10⁻³ 1 6.216×10-3 X1X2 3.782×10⁻³ 1 3.782×10-3 X1X3 3.660×10⁻³ 1 3.660×10-3 X2X3 9.409×10⁻³ 1 9.409×10-3 X1² 0.013 1 X2² 0.020 1 X3² 0.083 1 3.2. Analysis of response surface The response surface plots for the effects of independent variables on the yield of alkaloids were depicted in Fig. 1-3. 2-0.069 X2 2-0.14 X3 2 (2) MS 0.034 F- value 58.57 17.16 R2Adj= 0.9700 P- value <0.0001 8.0×10⁻⁷ adj of 0.9700 also indicate the 2, X2 2, X3 2 are significant model terms. MS 0.16 F- value 268.12 3.98 10.55 6.42 6.21 15.97 22.58 33.99 141.02 P- value <0.0001 0.0861 0.0141 0.0390 0.0414 0.0052 0.0021 0. 0006 <0.0001 0.013 0.020 0.083 1024
Kun Qinand Caihong Liu J. Chem. Pharm. Res., 2014, 6(4):1022-1026 _____________________________________________________________________________ The plots were obtained by plotting the response on the Z-axis against any two variables while keeping the third variable at zero level. As shown in Fig. 1-3, extraction time (X1) showed a linear increase effect on the yield while both ultrasonic power (X3) and liquid-solid ratio (X2) had quadratic effect on the yield. It was clear that extraction time (X1), ultrasonic power(X3) and the square effects among them had a significant effect on the yield. It also indicated that the interactions among extraction time, liquid-solid ratio and ultrasonic power impacted the yield significantly. The results above agreed well with Table 4. Fig. 1. Response surface plots showing the effect of extraction time and the ratio of liquid to solid on extraction yield of S. barbata alkaloids Fig. 2. Response surface plots showing the effect of ultrasonic power and the ratio of liquid to solid on extraction yield of alkaloids Fig.3. Response surface plots showing the effect of ultrasonic power and extraction time on extraction yield of alkaloids 3.3 Optimization of extracting parameters and validation of the model According to the RSM test results, the optimal extraction parameters were as follows: extraction time 60 min, liquid-solid ratio 55.47 mL/g, ultrasonic power 347.3 W and the predicted optimal yield was 1.40%. To verify the suitability of the equation model used for predicting the optimum response values, additional experiment was performed using this modified optimal conditions: X1=60 min, X2=55 mL/g and X3=350 W. The mean value of experimental yield was 1.39±0.061% (Table 5). No significant different (p > 0.05) was found between the experimental and predicted values of total alkaloids. Hence, the models can be used to optimise the process of total alkaloids extraction form S. barbata. Table 5 Optimum conditions and the predicted and experimental value of response at the optimal conditions. Extraction time (min) Liquid: Solid (mL/g) Optimum conditions 60 55.47 Modified conditions 60 55 CONCLUSION On the basis of the single factor experiments, RSM was used to optimize 3 experimental variables: extraction time, liquid-solid ratio and ultrasonic power. The variables of extraction time, ultrasonic power, and the square effects among them had a significant effect on the response value, followed by the significant interaction effects among extraction time, liquid-solid ratio and ultrasonic power. The optimum extraction parameters were obtained: extraction time 60 min, liquid-solid ratio 55 mL/g and ultrasonic power 350 W. Under these conditions, the Ultrasonic power (W) 347.30 350 Yield (%) 1.40(predicted) 1.39±0.061(actual) 1025
Kun Qinand Caihong Liu J. Chem. Pharm. Res., 2014, 6(4):1022-1026 _____________________________________________________________________________ experimental yield was 1.39±0.061%, which was agreed well with the predicted value. REFERENCES [1]ZJ Dai; XJ Wang; ZF Li; ZZ Ji; HT Ren; W Tang; XX Liu; HF Kang; HT Guan; LQ Song, World J Gastroenterol, 2008, 14(48), 7321-7328. [2]PG Pietta, J Nat Prod., 2000, 639(7), 1035-1042. [3]P Parajuli; N Joshee; AM Rimando; S Mittal; AK Yadav, Planta Med., 2009, 75(1), 41-48. [4]JQ Yu; HB Liu; JC Lei; WJ Tan; XT Hu; GL Zou, Phytother Res., 2007, 21(9), 817-822. [5]GW Qu; XD Yue; GS Li; QY Yu; SJ Dai, J Asian Nat Prod Res., 2010, 12(10), 859-864. [6]SJ Dai; JY Sun; Y Ren; K Liu; L Shen, Planta Med., 2007,73(13), 1217-1220. [7]X Mi; R Zhu, Se Pu, 2010, 28(2), 209-214. [8]SJ Dai; WB Peng; L Shen; DW Zhang; Y Ren, Nat Prod Res., 2011, 25(11), 1019-1024. [9]XL Wang; N Zhang; Q Huo; Q Yang, Oncol Rep., 2012, 28, 1167-1175. [10]MJ Chen; KN Chen; CW Lin, Journal of Food Engineering, 2005, 68(4), 471-480. [11]ER Gunawan; M Basri; BAM Rahman; AB Salleh; RNZA Rahman, Enzyme and Microbial Technology, 2005, 37(7), 739-744. [12]SLC Ferreira; RE Bruns; HS Ferreira; GD Matos; JM David; GC Brandão; EGP Da Silva; LA Portugal; PS Dos Reis; AS Souza; WNL Dos Santos, Analytica Chimica Acta,2007, 597(2), 179-186. [13]R Triveni; TR Shamala; NK Rastogi, Process Biochemistry, 2001, 36,787-795. [14]W Cai; X Gu; J Tang, Carbohydrate Polymers, 2008,71, 403-410. [15]PD Haaland. Experimental design in biotechnology, 1stEdition, Marcel Dekker Inc. Publishers & Distributors, New York, 1989, 243. 1026