Download
1 / 1
10 likes | 116 Views
6 Sigma Process Improvement Project Clinical Biochemistry Royal Gwent Hospital. Helen Archer 1 , Howard Hughes 1 Philip Waters 1 , Stuart Thomas 2 , Danny O’Sullivan 2 , Marc Baker 3 , Grant Robinson 4 , Marie Thorn 4 , Brent Varley 4

E N D
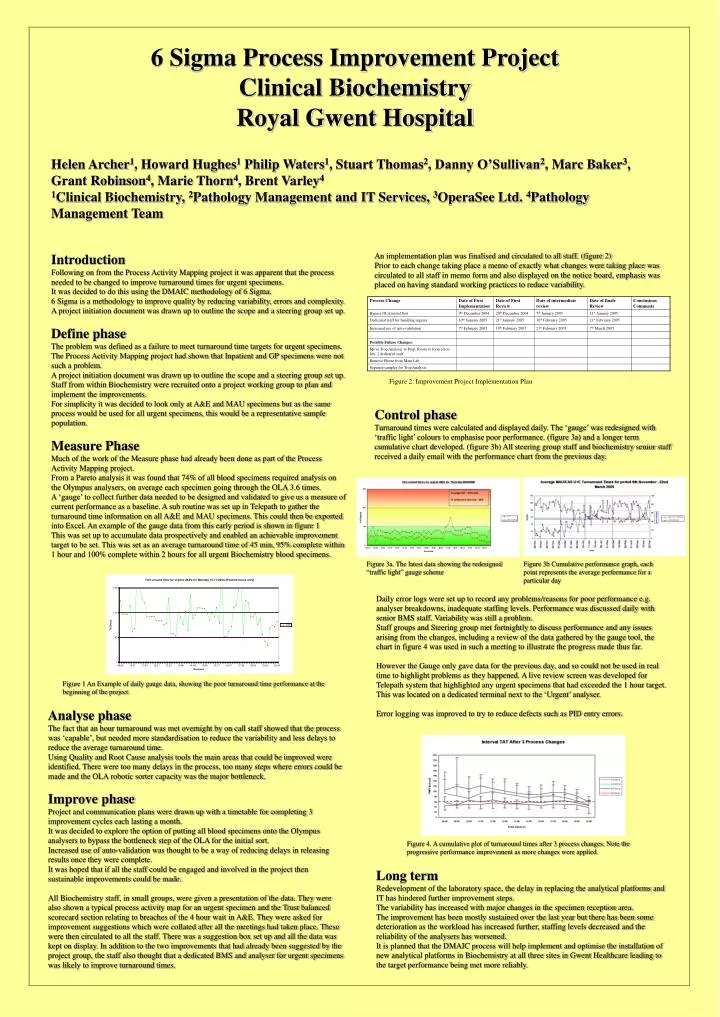
6 Sigma Process Improvement ProjectClinical Biochemistry Royal Gwent Hospital Helen Archer1, Howard Hughes1 Philip Waters1, Stuart Thomas2, Danny O’Sullivan2, Marc Baker3, Grant Robinson4, Marie Thorn4, Brent Varley4 1Clinical Biochemistry, 2Pathology Management and IT Services, 3OperaSee Ltd. 4Pathology Management Team An implementation plan was finalised and circulated to all staff. (figure 2) Prior to each change taking place a memo of exactly what changes were taking place was circulated to all staff in memo form and also displayed on the notice board, emphasis was placed on having standard working practices to reduce variability. Introduction Following on from the Process Activity Mapping project it was apparent that the process needed to be changed to improve turnaround times for urgent specimens. It was decided to do this using the DMAIC methodology of 6 Sigma. 6 Sigma is a methodology to improve quality by reducing variability, errors and complexity. A project initiation document was drawn up to outline the scope and a steering group set up. Define phase The problem was defined as a failure to meet turnaround time targets for urgent specimens. The Process Activity Mapping project had shown that Inpatient and GP specimens were not such a problem. A project initiation document was drawn up to outline the scope and a steering group set up. Staff from within Biochemistry were recruited onto a project working group to plan and implement the improvements. For simplicity it was decided to look only at A&E and MAU specimens but as the same process would be used for all urgent specimens, this would be a representative sample population. Measure Phase Much of the work of the Measure phase had already been done as part of the Process Activity Mapping project. From a Pareto analysis it was found that 74% of all blood specimens required analysis on the Olympus analysers, on average each specimen going through the OLA 3.6 times. A ‘gauge’ to collect further data needed to be designed and validated to give us a measure of current performance as a baseline. A sub routine was set up in Telepath to gather the turnaround time information on all A&E and MAU specimens. This could then be exported into Excel. An example of the gauge data from this early period is shown in figure 1 This was set up to accumulate data prospectively and enabled an achievable improvement target to be set. This was set as an average turnaround time of 45 min, 95% complete within 1 hour and 100% complete within 2 hours for all urgent Biochemistry blood specimens. Figure 2: Improvement Project Implementation Plan Control phase Turnaround times were calculated and displayed daily. The ‘gauge’ was redesigned with ‘traffic light’ colours to emphasise poor performance. (figure 3a) and a longer term cumulative chart developed. (figure 3b) All steering group staff and biochemistry senior staff received a daily email with the performance chart from the previous day. Figure 3a. The latest data showing the redesigned “traffic light” gauge scheme Figure 3b Cumulative performance graph, each point represents the average performance for a particular day Daily error logs were set up to record any problems/reasons for poor performance e.g. analyser breakdowns, inadequate staffing levels. Performance was discussed daily with senior BMS staff. Variability was still a problem. Staff groups and Steering group met fortnightly to discuss performance and any issues arising from the changes, including a review of the data gathered by the gauge tool, the chart in figure 4 was used in such a meeting to illustrate the progress made thus far. However the Gauge only gave data for the previous day, and so could not be used in real time to highlight problems as they happened. A live review screen was developed for Telepath system that highlighted any urgent specimens that had exceeded the 1 hour target. This was located on a dedicated terminal next to the ‘Urgent’ analyser. Error logging was improved to try to reduce defects such as PID entry errors. Figure 1 An Example of daily gauge data, showing the poor turnaround time performance at the beginning of the project Analyse phase The fact that an hour turnaround was met overnight by on call staff showed that the process was ‘capable’, but needed more standardisation to reduce the variability and less delays to reduce the average turnaround time. Using Quality and Root Cause analysis tools the main areas that could be improved were identified. There were too many delays in the process, too many steps where errors could be made and the OLA robotic sorter capacity was the major bottleneck. Improve phase Project and communication plans were drawn up with a timetable for completing 3 improvement cycles each lasting a month. It was decided to explore the option of putting all blood specimens onto the Olympus analysers to bypass the bottleneck step of the OLA for the initial sort. Increased use of auto-validation was thought to be a way of reducing delays in releasing results once they were complete. It was hoped that if all the staff could be engaged and involved in the project then sustainable improvements could be made. All Biochemistry staff, in small groups, were given a presentation of the data. They were also shown a typical process activity map for an urgent specimen and the Trust balanced scorecard section relating to breaches of the 4 hour wait in A&E. They were asked for improvement suggestions which were collated after all the meetings had taken place. These were then circulated to all the staff. There was a suggestion box set up and all the data was kept on display. In addition to the two improvements that had already been suggested by the project group, the staff also thought that a dedicated BMS and analyser for urgent specimens was likely to improve turnaround times. Figure 4. A cumulative plot of turnaround times after 3 process changes. Note the progressive performance improvement as more changes were applied. Long term Redevelopment of the laboratory space, the delay in replacing the analytical platforms and IT has hindered further improvement steps. The variability has increased with major changes in the specimen reception area. The improvement has been mostly sustained over the last year but there has been some deterioration as the workload has increased further, staffing levels decreased and the reliability of the analysers has worsened. It is planned that the DMAIC process will help implement and optimise the installation of new analytical platforms in Biochemistry at all three sites in Gwent Healthcare leading to the target performance being met more reliably.