Download
1 / 40
410 likes | 746 Views
Σ tati s tic s α t K Σ U. Six Sigma Process Improvement Workshop. Dr. Victor E. Kane Lorraine Starks-Gamble Department of Mathematics and Statistics And the Center for University Learning Kennesaw State University April 30, 2008. Introduction to Six Sigma – Success Stories.

E N D
Σtatisticsαt KΣU Six Sigma Process Improvement Workshop Dr. Victor E. Kane Lorraine Starks-Gamble Department of Mathematics and Statistics And the Center for University Learning Kennesaw State University April 30, 2008
Introduction to Six Sigma – Success Stories • Six Sigma Improves a work PROCESSES • Examples : Dummies p.12 • GE – Profitted $7 - $10B in 5 yrs. • Dupont – added $1 - $2.4B in 4 yrs • Bank of America – saved several Million by reducing cycle time and number of processing errors. • Honeywell – Saved $2B in operating costs.
Sigma relates to variation – are the observer data exactly the same? Or do they vary? • Studying a PROCESS requires quantifying the variation of key parameters. • Gas Station Fill UP – Cycle time, how long does it take? • Wait time for fast food (or other services)
For example wait times for service can be measured. Very large or small times are of interest. Why?
Big Means Big Variation
Number Defective Relates to Sigma Level Every % Defective Corresponds to a Sigma Level. E.G. 7% Defective is a 3 Sigma Level.
What is “Sigma” (Greek σ) ? For the wait times 5,8,10, 3,6, 7, 4, 1,8,2 we have = 2.91
Calculations are usuall done on a computer: • Variable Mean StDev Minimum • Data 5.400 2.914 1.000 • Note: one useful fact: 3 sigma interval contains about 99% of the future observations (0. 8.73) Need large samples.
Six Sigma – DMAIC Improvement Process ANALYZE: Examine Histograms for Service Wait Times What do each of the Histograms below communicate?
Common Themes - DMAIC • Performance is Defined by Measurements for a Work Process • Data is the focus of Analysis (Analyze) • Improvement is conducted by Teams • Process Control is an outcome
KSU Improvement Projects • Conference Planning/Registration – measured response times, satisfaction • New Hire Orientation – implemented web site; measured start up problems, satisfaction
KSU Projects con’t 3. Banner Improvement – measured No. days to establish INB Account, Measured satisfaction & No. Days and improved process from 25 days to 9 days(Improved 282%). 4.On-Time Completion Rate Design of Promotionals completion time (improved 40%) 5. Bookstore book adoption time improved from24.92 days to 2.55 days (90% improvement).
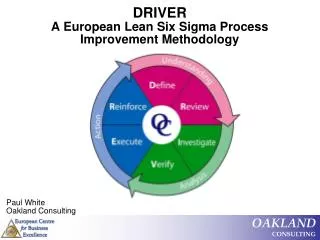
Six Sigma – DMAIC Improvement Process Define – Select a Project to Improve a performance measure Measure – Define the process and CTQ variables. Sample Process and Customers Analyze – Evaluate measures, find opportunities for improvement Improve – Experiment with solutions Control – monitor results, hold gains
Six Sigma – DMAIC Improvement Process DEFINE: The Opportunity for Improvement • Identify Measure to be Improved (Y variable) Examples: • Customer Dissatisfaction • Wait Time for Services • Cycle Time for Completing an Activity • Errors in Processing • Establish Team of Subject Experts • Develop Process Flowchart that Influences Measure • Identify Benchmarks for Better Performance • Develop Problem Statement and Goal
Six Sigma – DMAIC Improvement Process DEFINE: Preparing a Flowchart • Form a team of process experts • Identify key process requirements • Identify (preliminary) Critical to Quality (CTQ) customer requirements. • Identify all suppliers and other processes that provide input into the process. • Develop a sequence of normal process steps. • For each step note if ERRORS are possible and possible sources of VARIABILITY. • Indicate where Personnel (& how many) are involved in processing. • Define ALTERNATE paths by which work is accomplished.
Six Sigma – DMAIC & Process Mapping DEFINE: Common Flowchart Symbols Boundary (Start/End): Identifies the beginning or the end of a process. “Start” or “End” may be written inside. Operation: Identifies an activity or task in the process which changes an input. Usually the name of the activity is written inside Decision: Identifies a decision or branch point in a process. Write the decision inside. Label each path emerging from a decision block with the options, such as yes, no, or complete, incomplete, etc. Inspection: Identifies that the flow has stopped in order to evaluate the quality of the output or to obtain an approval to proceed. Delay: Identifies when something must wait.
Value Added Activity Stop Start Customer CTQ Process Requirements Supplier Input Six Sigma – DMAIC Start by Defining Work Process Example of simple flowchart:
Six Sigma – DMAIC Improvement Process Example flowchart of an application process: Send Acceptance Letter N • Student Submits: • Application • High School Transcripts • Other Required Info Evaluation of Student Application Reject? Student Y Reevaluate rejection Criteria • CTQ Requirements: • Answer Received in 1 month • Correct evaluation of qualifications • AP Credits granted • Orientation Scheduled Send Rejection Letter
Start – Enter Station Wait Pump Available? • Possible Variability: • Station Out of Gas • Pumps Inoperable • User Error Drive Up To Open Pump Get Out of Car Credit Card Accepted? Go To Store to Pay Cash Remove Cap Return to Pump Hose Reaches Car? Reposition Car Select Grade Start Fill Complete Fill? Return Hose Replace Gas Cap DMAIC: Process Flowchart – Purchase Gas for Car N Y • Possible Variability: • Card Reader Not Working • Only Cash Accepted N Y N • Possible Variability: • Gas Cap on other Side • Kink in Hose Y N Wait For Fill Y Exit Station
Six Sigma – DMAIC Improvement Process Start – Enter Station Wait Pump Available? N Y Drive Up To Open Pump • CTQ Customer Requirements: • Station Open When Start or Finish Trip • Gas Quality Meets Standards • Pumps Functioning • Hose Length Sufficient • Cashiers Trained • Safe Environment Get Out of Car N Go To Store to Pay Cash Credit Card Accepted? Y Return to Pump Remove Cap Hose Reaches Car? Reposition Car N Y Select Grade Start Fill N Wait For Fill Complete Fill? Return Hose Replace Gas Cap Exit Station
Six Sigma – DMAIC Improvement Process Process Efficiency: • Value-Added Time • Time to Provide Service to Customer • Example from Admissions: 2 hours to evaluate Acceptance criteria, average of 10 days to get back to student (2/(10x24) = 0.8% efficiency)
Six Sigma – DMAIC Improvement Process LEAN Concepts that Can Be Used for Six Sigma Projects • Improve PROCESS SPEED or CYCLE TIME • Improve FLOW of Work or Information Between Units • Identify and eliminate WASTE – non Valued-Added Activity • Reduce or Eliminate INVENTORY • Standardize Work • Use Team-Based Kaizen Events • Use Visual Management • Engage in 5S (Sort, Shine, Set in Order, Standardize and Sustain) Activities
Six Sigma – DMAIC Improvement Process Typical Metrics Used in Six Sigma Projects: • Customer Satisfaction or Dissatisfaction • Cycle Time (e.g. to develop a new course) • Wait Time for a Service to be Completed • Delay Time for an event to occur • Process Speed to provide a product or service • Throughput – units processed per day • Rework or Errors– Do Overs
Fast Food Metrics – AJC Jan 2007 Six Sigma – DMAIC Improvement Process
Metric Satisfaction Cycle Time Wait Time Throughput Do Overs Application Area CAPS: Student satisfaction with advising or orientation UPCC: Time to approve a new course HR: Time to replace clerical staff Admissions: Number of students process per day Registrar: Number of students applying for graduation that don’t qualify Six Sigma – DMAIC Improvement Process Six Sigma – Example Metrics for Universities
Six Sigma – DMAIC Improvement Process MEASURE: What Data is Needed & How Good are the measurements? • Assemble prior data • Start Collection (Flowchart Data Check Points) on key process measures • Assess process variability (e.g. multiple personnel, duplicate processes) • Assess repeatability and accuracy of measurements • Outputs, Internal & External Customers Identified • Critical to Quality (CTQ) Process Requirements Located in Work Flow • Decide what customer data is needed • Develop sampling plan and survey instrument JP
Six Sigma – DMAIC Improvement Process MEASURE: The Major Decisions in Survey Design • What should be asked? • How will the results be actionable? • How should each question be phrased? • How should the questionnaire be pre-tested? • Does the questionnaire need to be revised?
Six Sigma – DMAIC Improvement Process MEASURE: Key Issues and Solutions Guidelines Solution • Avoid ambiguity • Be clear and concise • Response choices that are • mutually exclusive • exhaustive • not “double-barrelled” • Use conversational, familiar language • Avoid complexity
Six Sigma – DMAIC Improvement Process MEASURE: Another Suggested Framework for Survey Development Is there an improvement before and after a process or change (a pre-post analysis)?
Six Sigma – DMAIC Improvement Process ANALYZE – • Determine X variables that may influence Y (Metric to be improved) using C&E Diagrams or FMEA’s • Use statistical summaries of data (X and Y) to look for patterns • Use statistical methods to find which X’s impact Y (e.g. regression)
Six Sigma – DMAIC Improvement Process ANALYZE: Cause and Effect Diagram Team Question: Why is there variability in (5M) that could cause the problem?? Materials Methods Measurements Problem Statement: The Effect Men Machine
Six Sigma – DMAIC Improvement Process Pareto Principle – 80% of a problem can be explained by 20% of the potential causes (80/20 Rule). Separate the “Vital Few” from the “Trivial Many.”
Six Sigma – DMAIC Improvement Process IMPROVE– Look at many alternatives • Often redesign of the process steps in the flowchart can produce improvement. Eliminate complexity. • Identify “Experiments” where process parameters ( X’s) are changed to improve Y (metric being improved). • Find X’s that correlate with Y and then adjust X’s to improve Y • Error Proof Process to make output more consistent • Incorporate technology (e.g. bar codes, light beams etc) where appropriate. • Develop on-going process metrics to monitor performance. Set standards for performance.
Six Sigma – DMAIC Improvement Process CONTROL – Hold the gains! • Use monitoring methods for critical X’s to ensure control of Y’s • Error Proof process inputs • Establish in-process control system • Use statistical tools such as control charts to monitor process and customer measures
Six Sigma – DMAIC Improvement Process Monitoring Complaint Calls Received per Day. React when more than 9 calls received – Something Changed!
Review: General • Define your unit’s process – develop a flowchart, identify the CTQs; • Measure – what drives customer satisfaction? what is important? Capture time, accuracy of processes; • Analyze – how is satisfaction related to importance? How is the process data shaped? Are there significant differences between (among) groups? Are there significant differences pre-post a change? • Improve – where are the opportunities for improvement? • Control – monitor your improvements. • Call the Department of Mathematics and Statistics – 770-423-6327
References • Damelio, R. (1996) The Basics of Process Mapping, Productivity Press, N.Y., N.Y. • George, M., Rowlands, D., Kastle, B. ((2004) What is Lean Six Sigma?, McGraw-Hill, N.Y., N.Y. • Gygi, C, DeCarlo, N., Williams, B. (2005) Six Sigma for Dummies, Wiley Publishing, Indianapolis, Indiana. • Kane, V.E. (1989) Defect Prevention, Marcel Dekker, N.Y., N.Y. • Stamatis, D. (2004) Six Sigma Fundamentals, Productivity Press, N.Y., N.Y.