Download

1 / 15
150 likes | 161 Views
Simultaneous Heliospheric Imager and Interplanetary Scintillation observations of CMEs and CIRs Gareth D. Dorrian (gdd05@aber.ac.uk) 1 , Andy R. Breen 1 , Jackie A. Davies 2 , Alexis P. Rouillard 3 , Mario M. Bisi (mmbisi@ucsd.edu) 4 , Ian Whittaker 1 , and Richard A. Fallows 1

E N D
Simultaneous Heliospheric Imager and Interplanetary Scintillation observations of CMEs and CIRs Gareth D. Dorrian (gdd05@aber.ac.uk)1, Andy R. Breen1,Jackie A. Davies2, Alexis P. Rouillard3, Mario M. Bisi (mmbisi@ucsd.edu)4, Ian Whittaker1, and Richard A. Fallows1 1Institute of Mathematical and Physical Sciences, Aberystwyth University 2Space Science & Technology, Rutherford Appleton Laboratory, STFC 3School of Physics and Astronomy, Southampton University 4Center for Astrophysics and Space Sciences, University of California, San Diego
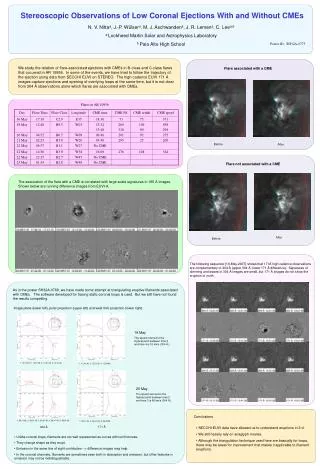
Techniques: interplanetary scintillation Phase variation converted to amplitude scintillation by interference Phase variation introduced by irregularities B P V Amplitude scintillation patterns recorded at two telescopes Sun Earth View from above N. Pole of Sun
Techniques: interplanetary scintillation Heliographic North IPS raypaths P-point • Make observations when both IPS ray-paths lie in the same Sun/Earth/P-point plane • Scintillation patterns recorded at the two telescopes (may be..) significantly correlated at some time-lag • Time-lag for maximum correlation provides first estimate of outflow speed (“P-point speed”) • Fitting auto- and cross-spectra gives better estimate of radial outflow speed • -ve lobe in cross-correlation function on short-lag side indicates field rotation in region of maximum scintillation • Large variability in correlation functions, P-point speed and scintillation level indicate variations in solar wind parameters Sun Earth View from just above Sun/Earth/P-point plane (Earth just below solar equatorial plane, P-point significantly above solar eq. plane)
Comparisons between HI and IPS IPS phase scattering event Radio Source Radio telescope “Raypath” • Phase scintillations induced by solar wind irregularities constructively and destructively interfere with each other during passage from scattering region to Earth: • Interference produces amplitude variations in the received signal which are the recorded IPS signals – IPS samples 100 times per second, requiring typically a minute to build up usable correlation functions (~15 mins to build up a “fittable” spectrum). • Distance over which amplitude variations build up (Fresnel filter distance) favours observations of more distant scattering regions, as phase variation will be fully converted into amplitude scintillation Thomson scattering event HI “Line of sight” Light from Photosphere The greater the distance between the Thomson scattering event and HI, the fainter the received signal – favours observations of scattering regions closer to observer (and inside the Thomson spheroid). HI-1 cadence 40 mins, HI-2 cadence 2 hours.
Date 25th. April 2007 16th. May 2007 Time 14:30 – 15:30 UTC 13:30 – 14:00 UTC EISCAT antennas (IPS) Kiruna, Sodankylä Kiruna, Sodankylä Radio Source (IPS) J0318+164 J0431+206 Plane of sky distance from Sun to source (IPS) 62.4 Solar Radii 52.2 Solar Radii Heliographic Latitude of P-point -12.5° -12.1° Observed features CIR seen by VEX, HI (best in HI-2-A), IPS (long-lived feature on 25, 26, 27 April). “Blob” seen by HI-1-A. Field rotation indicated by IPS observation on 25 April . No LASCO or COR CMEs Clear CME seen in LASCO, COR, HI. IPS observation on 16 April shows CME signatures, but too early for main CME front Case studies
25th April 2007: HI km.s-1 Formation of a CIR is expected from this warp Expected stream interface PFSS prediction of solar wind speed at source surface using the Arge et al. flux tube expansion factor/solar wind speed relation. Plot generated from slices of difference images extracted at constant radial distance on the Thompson sphere – only the most dynamic parts of the streamer are revealed.
Away Sector (South polar coronal hole) B Current Sheet crossing (Sector boundary) 25th April 2007: HI, VEX CIR expected at VEX 29-30th April 2007. Latitude ° Take-off of “blob” on the East-limb on ~24th Venus was 20° off the Limb ~ 1.5 days later. Venus is located 0.72AU away from the Sun => travel time is~ 4.00 days later for v=300kms-1
25th April 2007: IPS and HI IPS P-point mapped onto HI-1-A Thompson sphere as P’
25th April 2007: IPS and HI White cross represents position of IPS P-point as seen in HI-1A (P’) only at 14:30 on 25th. April 2007 • Vertical transient feature seen crossing P’ at ~14:30 UTC on 25th. April 2007. • Vertical transient feature is believed to be a developing CIR (better visibility in HI-2A, next slide) • Activity seen in the tail of comet Encke • No CME, but small flux-rope (“blob”) within the CIR causes local field rotation (-ve lobe near 0 time lag in IPS) • Rapid variation in cross correlation peak velocity seen in IPS during passage of HI blob – “3-stage event”, perhaps indicative of blob structure
25th April 2007: HI-2-A • Dark vertical feature at bottom right is CIR • Although it is moving away from the Thomson spheroid, it is increasingly visible • Build-up of compression more than compensates for increasing distance from Thompson spheroid • Eventually feature moves so far from Thomson spheroid that it fades from view • No CME in LASCO, COR or HI
15-16th May 2007: IPS and HI-1-A (Dorrian et al., 2008, Geophysical Research Letters) Fronts A and B converge near P’ point
15-16th May 2007: HI-1-A and IPS IPS scintillation level (top), velocity (middle) and HI-1-A pixel intensity at P’ point 15 May 16 May IPS observations reveal complex 2-stage structure in convergence zone of fronts A and B
Results • 25th April 2007: “Blob” entrained in CIR gives rise to field rotation during passage through IPS ray-path. Blob(s) appear(s) to originate near coronal hole boundary, subsequently swept up by CIR compression region. “April 25 blob” misses Venus impact by 2 days, but CIR clearly detected by VEX (Dorrian et al., 2009a, in preparation) • Also appears to have some effect on the dynamics of the tail of Comet Encke and signatures in the “magnetosphere” of Venus, from ASPERA-4 data on VEX (Dorrian et al, 2009b; Breen et al, 2009, both in preparation) • 16th May 2007: We observe significant coronal mass ejection feature in HI-1A which gives rise to significant variation in IPS cross-correlation peak velocity, scintillation level and evidence for field rotation (Dorrian et al., GRL, 2008) • IPS observation appears to precede main CME feature and instead detects interaction between two faint fronts, with the second (faster) one sweeping up the first • IPS and HI observations can be used in a highly complimentary fashion to obtain high time resolution information of transient solar wind features in interplanetary space
Discussion • The fast sampling rate of IPS allows resolution of solar wind features of the order of 100km in size and 1 minute cadence, compared with 40 min cadence for HI-1 and 2 hour cadence for HI-2 • HI provides crucial ability to interpret structures being observed in IPS – first time this has been possible for structures in interplanetary space • Currently working on development of concept of surfaces of equal local scattering/brightness (isosurfaces) in direction of observer for white light and equal scintillation level for IPS • Capability enhanced by in-situ data e.g. ASPERA-4 on Venus Express, or comet tail activity
Acknowledgements EISCAT scientific association STEREO HI team, STFC Rutherford Appleton Laboratory, UK STEREO Science Centre, NASA.