Download
1 / 20
200 likes | 461 Views
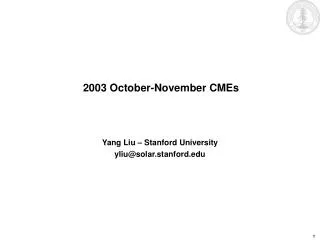
Heliospheric Observations during October – November 2003. Hari Om Vats Physical Research Laboratory Ahmedabad 380009 INDIA Email: vats@prl.ernet.in. ICRC meeting, 3 – 10 August 2005, Pune, INDIA Session: SH.3.5. October – November 2003. Bz is largely positive

E N D
Heliospheric Observations during October – November 2003 Hari Om Vats Physical Research Laboratory Ahmedabad 380009 INDIA Email: vats@prl.ernet.in ICRC meeting, 3 – 10 August 2005, Pune, INDIA Session: SH.3.5
October – November 2003 Bz is largely positive It remains so during strong geomagnetic activity Ap and Dst indicies show evidence of strong geomagnetic activity
Bastille day event 14 July 2000 Dst is +ve or low –ve for most of the - Bz Dst is highly –ve for + Bz Ap is high and low for - Bz
Bastille day event 14 July 2000
May 4 – 16 1999 (solar wind disappearance event; May 11 – 12)
Conclusions • Sunspot number, area, radio flux and flare index show a distinct enhancement during Oct. – Nov. 2003. • No apparent correlation with –ve Bz seen • Log of solar wind pressure gives largely linear relation with Kp Index. • The slopes of log (nPa) and Kp plots 6 Oct.- Nov. 2003 most active period 4 14 July 2000) Bastille day 2 May 11 – 12 1999 SW disappearance
October-November, 2003 Bastille day event July 14, 2000 Dst seems to have no dependence of solar wind pressure
High speed streams Characteristcs Duration Vmax Flare Coronal Hole Similar Vats 1992a Catalogue Mavromichalaki et. al 1988 Flare Coronal Hole Coronal Hole Flare
Flare Generated Streams with – and + IMF both seem to generate big geomagnetic storms. Coronal hole associated Stream with – IMF seems to generate a mild geomagnetic storm.
Coronal hole associated Streams with – and + IMF generate a mild to Strong geomagnetic storms. Flare Generated Stream with – IMF generate a strong geomagnetic Storm.
Streams with – and + IMF generate geomagnetic storm. Vp and Ap enhamcement plot has two slopes with a threshold at ~850 km/sec. GAER for Vp >850 km/s 0.73 and 0.53 for + and – IMF respectively GAER for Vp <850 km/s 0.08 and 0.09 for + and – IMF respectively Geomagnetic activity enhancement rate (GAER) is defined as an average increase in Ap value per unit average increase in the peak solar wind velocity (Vp) during the stream.
Flare Coronal Hole Coronal Hole Flare Geomagnetic effects Storm duration and Magnitude Associated with flare and Coronal Hole are quite different. Flares produce 2.7 times stronger storms. Coronal holes produce longer (1.5 times) duration storms Vats (1992b) GAER = 0.58 GAER = 0.12 GAER = 0.07 G = 0.64 S – 0.15 G = 0.42 S – 0.35
Conclusions • HSS (Flares and coronal holes) enhance geomagnetic activity irrespective of IMF polarity. • HSS >850 km/s GAER 0.73 and 0.53 for + and – IMF resply. • HSS <850 km/s GAER 0.08 and 0.09 for + and – IMF resply. • HSS (Flares) produce 2.7 times stronger storms. • Coronal holes produce longer (1.5 times) duration storms. • Sunspot number, area, radio flux and flare index show a distinct enhancement during Oct. – Nov. 2003. • No correlation with –ve Bz seen • Log of solar wind pressure gives largely linear relation with Kp Index. • The slope is more (1.5 times) steep during Oct.- Nov. 2003 than that during Bastille day (14 July 2000)