Download
1 / 29
290 likes | 438 Views
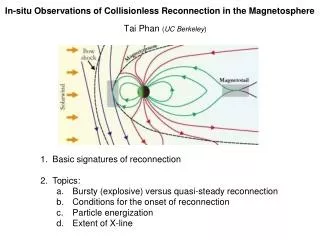
In-situ Observations of CIRs on STEREO and ACE during 2007-2008 G. M. Mason, JHU/APL, Laurel, MD 20723 M. I. Desai, SWRI, San Antonio, TX U. Mall and R. Bucik, MPS, Lindau, Germany K. Simunac, Univ. New Hampshire R. A. Leske, Caltech, Pasadena, CA STEREO SWG #19

E N D
In-situ Observations of CIRs on STEREO and ACE during 2007-2008 G. M. Mason, JHU/APL, Laurel, MD 20723 M. I. Desai, SWRI, San Antonio, TX U. Mall and R. Bucik, MPS, Lindau, Germany K. Simunac, Univ. New Hampshire R. A. Leske, Caltech, Pasadena, CA STEREO SWG #19 Pasadena, CA Feb-3-5, 2009
Solar Enegetic Particle (SEP) package - (Part of the IMPACT suite, J. Luhmann, PI) (SEP package on STEREO-A) figures from Mewaldt et al., SSR, 136, 285, 2008
Suprathermal Ion Telescope - SIT: instrument description: Mason et al., SSR, 136, 257, 2008.
Solar wind and magnetic field signatures of CIRs Richardson et al. 1993, after Belcher & Davis 1971
Fig. 5 Geocentric Solar Ecliptic positions of STEREO-Ahead and STEREO-Behind from launch through 2008 day 343. Numbers by each position trace indicate day of 2007 or 2008. The green Archimedes spiral line is for a nominal 650 km/s solar wind speed.
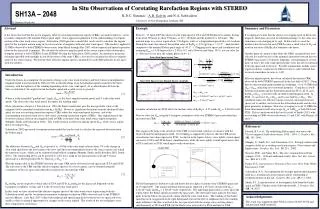
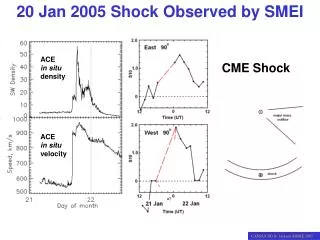
top panel: plastic sw proton speed middle panel: SIT He, for 189, 384, and 787 keV/nucleon arrow marks selection threshold figure shows events 15-21 in Table 1. Note increases starting on days 258, 261,284 and 291 are below the selection threshold and so are not in the table bottom panel: SIT O for 67, 136, and 266 keV/nucleon note high speed streams with no suprathermals around day 305, 315, and 330 note: 650 km/s solar wind speed corresponds to 2.2 keV/nucleon; the speeds for the suprathermals are: 67 keV/n = 3589 km/s or 5.52 x greater than 650 189 keV/n = 6027 km/s, 9.3 x greater than fast sw 787 keV/n = 12294 km/s, or 18.9 x greater than fast sw calculated with xls flight times sheet Fig. 1 Hourly average values from STEREO-A over a 100 day period in late 2007; Top panel: solar wind proton speed; Middle panel: suprathermal He intensities for 189, 384, and 787 keV/nucleon; Bottom panel: suprathermal O intensities for 67, 136, and 266 keV/nucleon. Arrow on middle panel shows approximate selection threshold for CIRs in survey.
Spectral forms: broken power law-- SIT-B Fig. 3 ACE/ULEIS spectra for the CIR starting Feb. 10, 2008 (#25 in Table 2). Filled red circles: He; inverted diamonds: C; lower filled squares: O; upper filled squares: Fe; dashed line: He spectral shape measured in the March 22, 2000 CIR
Peak intensity: • during ACE survey over recent solar maximum, peak He intensities (386 kev/n) did not correlate with the 160-910 keV/n spectral index Fig. 4 Peak intensity for 386 keV/nucleon He vs. differential energy power law spectral index over the range 0.16-0.91 MeV/nucleon for 1998-2006 (filled red circles), and2007-2008 (half-filled squares, values in Table 1).
Event sizes: • largest ones during 2007-08 as large as all but a few during recent solar activity maximum • smaller events included in present survey might not have been seen earlier due to other activity
Phase of CIR: • recurrent CIRs show origin at same or nearby coronal holes • more complex pattern in early 2007 • gives way to 2 steam per rotation pattern from later 2007 through the first prt of 2008 • single feature seen in more recent data Fig. 2 Day of Bartels rotation for each CIR in Table 1 vs. the time of the CIR at ACE (year).
Peak intensity: • for 2007-2008 period the peak intensity does not depend on the solar longitude of the source regions -- see widely different intensities from each region • suggests that connection details are important even if the regions are fairly stable in production of energetic particles
Connection to CIRs: • with source of particles beyond 1 AU, region of connection of spacecraft to outer region depends on solar wind speed • simple corotating picture sometimes works, but often is more complex Morris et al., API CP598, 2001
Spectograms from -A and -B in spring 2007...quite similar plot from R. Bucik, MPS
Aug. 2008 spectograms (~5 days corotation) ... some features shifted as expected, others not seen on both S/C ? ? plot from R. Bucik, MPS Fig. 6 Spectrograms of ion energy vs. arrival time for SIT-A (upper panel) and SIT-B (lower panel) for August 2008. During this period the angular separation of the two STEREO spacecraft increased from 65.4ー to 71.2ー, or roughly five days of corotation. Double ended arrows point to nominally associated features, or associations that were observed on one spacecraft by not the other.
Fig. 7 Hourly average 189 keV/nucleon He intensities from SIT-A (red, top panel), ACE-ULEIS (green, middle panel), and SIT-B (blue, bottom panel). The time axes of the plots have been shifted by the nominal corotation delays such that steady corotating features would line up on the page. The dashed line is to guide the eye for the onset of the CIR starting 2008 day 222 at ACE (event #32 in Table 1).
Stereo-B SECCHI 19.5nm image Aug 7, 2007 00:06:32 (day 220) 10 degree heliographic grid overlay as seen from STEREO-B Central meridian seen from STEREO-B is in blue; green as seen from Earth; red as seen from STEREO-A Solar Weather Browser image Stereo A is at 8.98° latitude; B at 3.78°; so the 5.2° difference is about one-half of a grid spacings. The hole at about E45 is probably the one seen by STEREO-B on day 224-26, and was probably missed by STEREO-A since it’s trace is about 5°‚ north of B, a size shown by the double headed arrow at E5 Fig. 8 SECCHI-B 19.5 nm image taken on 2008 day 220 showing the coronal hole feature giving rise to the event #32 shown in Fig. 7. Blue longitude line is central meridian (CM) seen from STEREO-B, green is CM seen from ACE, red is CM seen from STEREO-A. Double headed arrow near CM shows the approximate latitude difference between STEREO-A and -B at this time. Grid on image has 10° spacing.
Difference between SIT-A and SIT-B spectral index for He vs. heliographic latitude difference between the two spacecraft. The correlation coefficient between the two quantities is 0.62, which has a <0.1% chance of arising from unrelated variables (n=36). correlation coef = 0.61, prob of accidential ~0.0001; if we remove outlier at diff near 10°, then corr coef = 0.44 (prob ~1%); if 2nd outlier removed corr = 0.30, prob ~10%)
“Dropout events” -- • in several CIRs, particle intensity increases show a decrease at all energies, followed by a recovery that is also independent of energy • these decreases correlate reasonably well with changes in solar wind speed • particle energy spectra are similar before and after the droput, although intensities may change • these features suggest that connection to the acceleration region beyond 1 AU is responsible for the dropouts -- not temporal changes in the CIRs
Fig. 13 ACE (a) solar wind speed, (b) 189 keV/n He intensity (particles/s cm2 sr MeV/nuc), (c) 4-hour average suprathermal He spectral slope for intensity bins centered at 193 and 772 keV/n, and (d) ion arrival spectrogram for C and heavier elements, showing CIR “dropout” early on day 44 and at day ~46.3. Brief low energy events (e.g., near day 45.5 or 46.1) are upstream ions from the Earth’s bow shock.
event counts: 2007-08 period: 36 1998-2006 period 34 events (remaining 7 events in ApJ survey are in 2007, and so assigned to STEREO survey) 94-97 data: 12 from STEP/LICA survey; 2 additional ones added for this figure (one in 1996, ond in 1997). Fig. 10 CIR peak hourly intensities of 386 keV/nucleon He from Wind/STEP (red diamonds) ACE ULEIS 1998-2006 (blue filled circles) and ACE ULEIS current 2007-2008 survey (green half-filled squares). Orange line: monthly smoothed sunspot number (right axis). 1994-97 points from Mason et al. (1998) with two additional events added for this plot; 1998-2006 data from Mason et al. (2008b).
Fig. 11 Left: histogram of peak event intensities for 10 MeV protons for 225 solar energetic particle events observed by GOES satellites from 1976-2006 (from NOAA web site); Right: peak event intensities for 320-450 keV/nuc He for CIR events observed from 1994-2008 (red shading) and 2007-2008 survey subset (blue hatching). Below peak intensities of ~10 (/s cm2 sr MeV/nuc) the CIR histogram is missing events during solar active periods due to SEP background, but this does not affect the 2007-2008 subset.
Wind SWE proton speed (blue) from kp data; STEP He5/1.6 -- division by 1.6 to adjust energy window to correpond approximately (20%) to ACE 386 keV/n channel; Wind data blanked out for R<25Re; for solar activity days 1997/308.0-318.0, and for interplanetary shock event on 1997/326 (ACE disturbance list) Fig. 12 Hourly average Wind observations of solar wind protons (top panels) from the SWE instrument, and suprathermal He (lower panels) from the EPACT/STEP instrument. Left: 1996-1997; Right: 2007-2008.
Summary -- • many fast solar wind streams and CIRs observed in 2007-2008, but not all streams produced CIRs • spectral forms similar to earlier surveys; much lower intensities at ~few MeV/n compared to active period • CIRs observed sequentially from -B to -A, but not always seen; energetic particle intensity pattern did not corotate rigidly, probably due to magnetic connection effects to the CIR beyond 1 AU • for 1994-2008 the most intense CIRs were during solar active periods, but cannot pinpoint simple cause for this
2007-2008 period had much better defined high speed solar wind streams than prior solar minimum in 1996-1997, and many more CIRs • size distribution of CIRs shows a much sharper cutoff than 10 MeV SEP protons from GOES • about 25% of CIRs show “dropouts” for a day or so apparently when connection to acceleration region beyond 1 AU changes • some of the complex features of the CIRs appear to be due to relatively small coronal hole solar sources, wherein the different heliolatitude traces of STEREO-B, -A, and ACE played a significant role • (survey submitted to Solar Physics STEREO special issue)