Download
1 / 54
560 likes | 650 Views
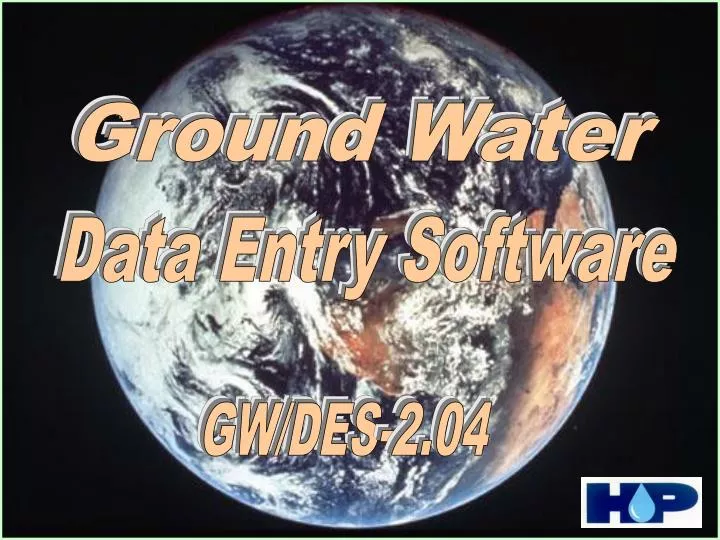
Ground Water. Data Entry Software. GW/DES-2.04. Madhya Pradesh. Chhattisgarh. HYDROLOGY PROJECT INCLUDES. Gujarat. Orissa. Maharashtra. Andhra Pradesh. Karnataka. Tamil Nadu. Kerala. Groundwater Data Entry Software. TIME DEPENDENT DATA. TIME INDEPENDENT DATA. ENTER.

E N D
Ground Water Data Entry Software GW/DES-2.04
Madhya Pradesh Chhattisgarh HYDROLOGY PROJECT INCLUDES Gujarat Orissa Maharashtra Andhra Pradesh Karnataka Tamil Nadu Kerala
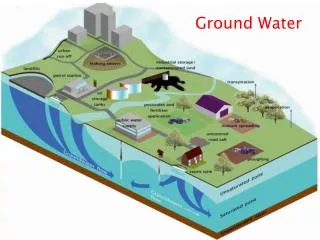
Groundwater Data Entry Software TIME DEPENDENT DATA TIME INDEPENDENT DATA ENTER
GRAPHICAL VISUALISATION Groundwater Data Entry Software ON-LINE DATA VALIDATION RELIABILITY
CUSTOMISED ENTRY SCREENS Groundwater Data Entry Software USER-FRIENDLY ENVIRONMENT EFFICIENCY
ORGANISED RELATIONAL DBs Groundwater Data Entry Software USER AUTHORISATION SECURITY
FLOW CHART FOR OPERATION OF GWDES VERSION 2.04 GW/DES Select Work Area Login Password Exit Valid user? N Y Main Switch Board Exit Data Entry/Edit Reports Export N New File? General Advanced Validation Close Add Rec. Y Well Information Close Well Detail Water Quality Lithology Water Level Water Quality Well Lithology Water Level Close DWLR Data Rainfall
Features of Data Entry Software GWDES 2.04 • UPGRADATION OF VERSION 1.01-2.03 • DOCUMENTATION OF CURRENT DATA ( FROM NEW PIEZOMETERS AND MONITORING WELLS ) • SIEVE ANALYSIS • IMPORTING DWLR DATA, RAINFALL DATA • DWLR ANALYST • EXPORT OF DATA TO ANALYTICAL SOFTWARES
Technical Features & Specifications Developed on WINDOWS platform MS-OFFICE compatible Compatible with all standard analytical software Graphics User Interface Context Sensitive Help Generation of reports & graphs Customized to User Requirements Standardisation of Codes User Authentication & Access Rights
Select Workarea Enter Login & Password Here
Define Users
Create Work Areas
State/District/Tahsil/Block State Tahsil District Block
Basin/Sub Basin/Minor Basin Basin Sub basin Minor Basin
Customise WQ Screen
Additional WQ Parameters
Consolidate Databases
Water Level Water Quality Lithology Well Details Enter Well Number Choose Well Type Well Information-General (Enter Static Information)
Well Details Enter Bore Well Details
Well Details Enter Dug Well Details
Well Details Enter Tube Well Details
Lithology Lithological Information
Composite plot of a Well Lithology Electrical Log Water bearing zones Well design Drill time log
Water Quality Water Quality
Water Level Water Level Select datafile to import Select DWLR type Import DWLR Data Select to view datafile Select to view imported data
Water Level User defined Reference You can change it !!! Select to change Channel Number DWLR Serial Number Total Records in Datafile
Water Level Delimiter Date and Time Format Press Continue to import Press Abort to Stop import
Select file where to export and Press Save
General Tube well construction well General well information Dug well detail Tube well detail Water quality (meq) Dug-cum-borewell detail Bore well details Water quality Hydrograh of wells DWLR Hydrograph of wells
You can edit Report Header Advanced-WL You can select Manual Water Level or DWLR or Both to View the Reports as well as the Graphs Categorisation of water level fluctuation Water level fluctuation in hydrograph stations Categorisation of change in water level with respect to mean of last n years Water level fluctuation with mean of last n years Water level fluctuation from mean of last n years Ground water level trend Well frequency for different ranges of water table Minimum, Maximum and Average Water Level of a given period
Advanced-WQ Parameter Corelation Graph of Single station Time Series Graph Parameter Corelation Graph of Multiple station Piper Diagram Box-Whisker Graph of a given range Stiff Diagram Box-Whisker Seasonal Graph Wilcox Diagram Water quality fluctuations in different stations Well frequeny of different ranges of Water quality data Trend Report
Validation Check for completeness of data Well types and dimensions Check for drainage basin Incorrect entries of drilling information Chemical analysis data
Composite Hydrograph Rainfall Data Water Level Manual Data DWLR Data
Season Select Well(s) Zoom view Superimpose view Date from Date to All Pre Monsoon Post Monsoon
Spectral Analysis Harmonic Analysis Optimal Analysis Summary Statistics Positive and Negative Runs