Download
1 / 46
460 likes | 606 Views
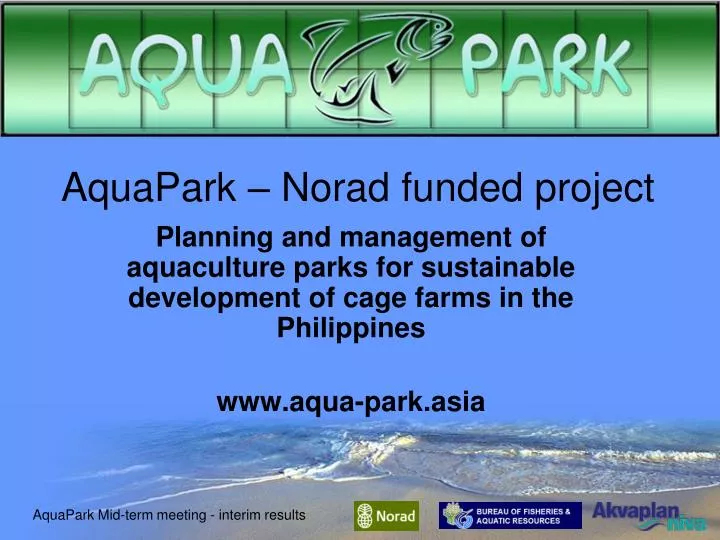
AquaPark – Norad funded project. Planning and management of aquaculture parks for sustainable development of cage farms in the Philippines www.aqua-park.asia. Mariculture park management. Mooring trial Oil spill contingency planning Better Management practices Socio economic survey

E N D
AquaPark – Norad funded project Planning and management of aquaculture parks for sustainable development of cage farms in the Philippines www.aqua-park.asia
Mariculture park management • Mooring trial • Oil spill contingency planning • Better Management practices • Socio economic survey • Economic analysis • Layout optimisation • Integrated Aquaculture AquaPark Mid-term meeting - interim results
Mooring Trial Mooring Scale Model
Typical cage mooring 12 m 15 – 20 m 15 m 15 m Mooring Scale Model
Mooring trial - scale model 1.2 m 1.5 – 2.0 m 1.5 m 1.5 m Mooring Scale Model
Mooring trial - scale model Mooring Scale Model
Mooring trial - scale model Measure kilos of pull needed to move the moorings 1.2 m 1.5 – 2.0 m 1.5 m 1.5 m Mud on bottom of tank Mooring Scale Model
Improved Mooring System Independent block moorings, upward lift Mooring Scale Model
Independent block moorings, sideways lift Improved Mooring System Mooring Scale Model
Interlinked block moorings, upward lift Improved Mooring System Mooring Scale Model
Scale Model Set-up Mooring Scale Model
Results – oil spill contingency This working report attempts to summarise the measures that Mariculture parks can take to be prepared to deal with oil spills. The reports summarises • Biological impacts of spills on fish, shellfish and sensitive environments • Oil spill contingency planning and response • Cleanup • Compensation. AquaPark Mid-term meeting - interim results
Results – Better Management Practices Draft BMPs which follow the culture process as follows Crosscutting issues 1. Planning and siting 2. Farm design and construction • Fry and Fingerling purchase or collection • Nursery production 4 Production management 5 Fish health 6 Fish quality and food safety 7 Harvest and post harvest management 8 Monitoring and record keeping 9 Social (staff training, health and safety) 10 Environmental management 11 Dive Operation in Marine Farms AquaPark Mid-term meeting - interim results
Socio-economic survey Undertook socio-economic analysis (positive & negative) either perceived or verifiable impacts of implementing Mariculture Parks for • farmer-beneficiaries, • Upstream and downstream stakeholders and • Local communities and LGUs. AquaPark Mid-term meeting - interim results
SOCIOECONOMIC FRAMEWORK - ADVANTAGES & BENEFITS • UPSTREAM OPPORTUNITIES /ACTIVITIES: • Feeds Suppliers; Fry / Fingerlings Suppliers • Development of Fish Hatcheries/Fish Nurseries • Sellers/Suppliers of Bamboos, Nets, Ropes, Twines , boat makers • Create employment (support staff) MARICULTURE PARK • EFFECTS / DIRECT BENEFITS : • Create employment opportunities • to local communities; Livelihoods • Incremental change of income for • marginal fishing families – as • caretakers, harvesters, cage • makers, feeders, cage repairers, • security guards, net washers, etc. ADDITIONAL REVENUE TO LGUs (permitting, licensing system) • DOWNSTREAM OPPORTUNITIES/ ACTIVITIES: • Fish Traders, Fish Vendors • Fish Processors; Ice Sellers • Transport rentals • Marketing channels and locations • PERIPHERAL EFFECTS / INDIRECT BENEFITS: • Establishments of General Merchandise (sari- • sari) Stores; Bakeshops • Establishments of coffee shops, restaurants, etc.
Economic survey • Investigate the economics and economic benefits of mariculture parks for the different types of locators and for the local Government/BFAR MP development, technical and infrastructure support in case study areas. • Assess and compare the economic influence of MPs in the case study locations and the comparative regional differences for input costs and market prices AquaPark Mid-term meeting - interim results
Economic survey The key components of this investigation are to assess the economics of: • Different aquacultural farming systems in the MPs; • LGU and BFAR support for setting up and providing support of the MP • Differences in regional input cost comparisons, • Cost/benefit and breakeven analysis for support infrastructure • Local and regional market analysis comparisons. AquaPark Mid-term meeting - interim results
LOCAL GOVERNMENT UNITS Investment on infrastructure (e.g. roads, markets, etc, Investment on services Power supply, etc. GOVERNMENT AGENCIES BFAR, DAR, DENR, etc.) Technical services Legal services Manpower development PRIVATE SECTOR Feed companies Fish seed production Laboratory services (fish disease lab, analytical lab, etc.) ٭ How can these infrastructures and services improve the life of the stakeholders? Are these investments economically viable?
Mariculture park optimisation • Started work on trying to optimise Sual production • Chris Cromey presentation AquaPark Mid-term meeting - interim results
TROPOMOD cage layouts Scenario B1 – AquaPark scenario Three 10 ha areas 100 cages per 10 ha No space in the middle of the zone Scenario A3 – existing cage layout Scenario B2 – AquaPark scenario Three 10 ha areas 40 cages per 10 ha 100 m space in middle of blocks to allow flushing Scenario B3 – AquaPark scenario Three 10 ha areas 56 cages per 10 ha 100 m space in middle of blocks to allow flushing
Scenario B1 – AquaPark – three 10 Ha areas with 100 cages (11 rows by 9 columns) in each Impact is very severe under cages and predicted to be worse than existing situation Scenario A3 – existing situation at Sual
To attempt to improve on the severe predicted impact in scenario B1, we maintain the 30 ha areas and reduce the numbers of cages in each area.
Scenario B2 – AquaPark – three 10 Ha areas with 40 cages each (2 blocks of 20 cages) Predicted impact is much improved, with lanes between the blocks of cages where predicted impact is lower. Scenario A3 – existing situation at Sual
To attempt to improve on the predicted impact in scenario B1, we examine the husbandry practices. In the model, we waste less feed, use a higher quality feed with better digestibility. This means we can also feed less. As husbandry practices are better, we can increase the number of cages in the three 10 ha areas from 40 per area to 56 cages.
TROPOMOD model input data – scenarios of husbandry practices Husbandry data obtained from production surveys at Sual used in the scenarios. All cages – circular 20 m diameter by 12 m depth with Milkfish
Scenario B2 – AquaPark – three 10 Ha areas with 40 cages each (2 blocks of 20 cages) Scenario B3 – AquaPark – three 10 Ha areas with 56 cages each. By improving husbandry, an additional 16 cages could be included per 10 ha
TROPOMOD model – summary of scenarios Average stocking density = 8.9 kg m-3 Target FCR (wet weight) = 2.2 Specific Feeding Rate (SFR) = 1.6 (scenarios B1 and B2) and 1.2 (scenario B3)
Integration of IMTA • Developing Integrated Multitrophic Aquaculture practice into Mariculture Parks AquaPark Mid-term meeting - interim results
IMTA scenario 2 (Panabo) – wastes from cages reaching suspended culture % of waste feed and faeces intersecting suspended culture 7% 15% 22% 25% 20% 17% 12% 7% Suspended culture Sediment 25 m 10 m 5 m 3m 0 m 0 m 3m 5m 10 m 25m Distance from cage edge (m) Further away from the cages (25 m), particles have settled out and do not reach the suspended culture
IMTA scenario 2 (Panabo) (view from above) North 7% 12% 17% 20% Percentage of waste feed and faeces reaching suspended culture 4% 10% 16% 20% 13% 9% 5% 1% 25% 22% 15% 7% For Panabo, residual current to the south means predictions are higher at the IMTA units to the south, and lower to the east Distance from cages 3m 5m 10m 25m
IMTA scenario 2 (Panabo) – wastes from cages reaching suspended culture at different depths % of waste feed and faeces intersecting suspended culture 0-3m 3-6m 6-9m 9-12m 12-15m 1% 4% 11% 16% 13% 9% 5% 1% 2% 5% 8% 8% 7% 6% 6% 2% 2% 2% 3% 2% 2% 2% 2% 2% 1% 1% 1% 1% 1% 1% 2% 2% 1% 1% 1% 1% 1% 1% 1% 1% 25 m 10 m 5 m 3m 0 m 0 m 3m 5m 10 m 25m Distance from cage edge (m) The majority of the wastes intersect the suspended culture in the top 6 m; these wastes are mostly fine and slow settling Milkfish faeces Net depth is important when considering optimum depth of suspended culture
IMTA scenario 3 (Panabo) – plume from cages reaching seaweed culture at different depths % of plume intersecting seaweed culture to the EAST of the cages Plan view N 0-3m 3-6m 6-9m 9-12m 12-15m 19% 14% 8% 3% 2% 2% <1% <1% <1% <1% <1% <1% <1% <1% <1% <1% <1% <1% <1% <1% 0m 3m 5m 10m 25m Distance from cage edge (m) The majority of the plume containing dissolved nutrients intersects the seaweed culture in the top 3 m. Net depth is important when considering optimum depth of seaweed culture
IMTA scenario 3 (Panabo) – plume from cages reaching seaweed culture at different depths % of plume intersecting seaweed culture to the SOUTH of the cages Plan view 0-3m 3-6m 6-9m 9-12m 12-15m N 9% 18% 26% 32% 2% 3% 3% 3% <1% <1% <1% <1% <1% <1%<1% <1% <1% <1% <1% <1% 25 m 10 m 5 m 3m 0 m Distance from cage edge (m) More of the plume intersects seaweed culture to the south of the cages as this is the direction of the residual current Net depth is important when considering optimum depth of seaweed culture
IMTA scenario 3 (Panabo) – plume from a large polar circle cage reaching seaweed culture at different depths % of plume intersecting seaweed culture to the SOUTH of the cages 0-3m 3-6m 6-9m 9-12m 12-15m Plan view N 6% 10% 11% 12% 6% 10% 12% 12% 5% 7% 9% 10% 1% 1% 2% 1% <1% <1% <1% <1% 25 m 10 m 5 m 3m 0 m Distance from cage edge (m) A deeper net means more of the suspended line comes into contact with the plume Seaweed culture at depth will be limited by light rather than nutrients
IMTA scenario 1 – benthic structures TROPOMOD predictions of the waste feed and faeces depositing on 8 m by 8 m structures on the sea bed Structures for benthic culture
North IMTA scenario 1 (Panabo) (view from above) Benthic structures <1% 1% 3% Percentage of waste feed and faeces reaching bethic structures 4 % 2% <1% <1% 0% <1% 4% For structures on the sea bed, around 20% of wastes deposited within 8 m of the cages Fine, slow settling Milkfish faeces are dispersed away from these structures 4% <1% <1% Distance from cages 3m 11m 19m
IMTA 4 – cage in a cage Grouper are in the inner cage, Milkfish in the outer cage Clean outer nets are essential Assumptions – all units are dry mass except the ration 100 units wet feed 3 feed 11 faeces 1 feed 1 faeces 7 faeces Grouper: wasted feed – 12%, digestibility – 49 %, wet FCR 7.5 Milkfish: consumes 70 % of waste feed, 30 % of waste faeces