Download
1 / 23
230 likes | 286 Views
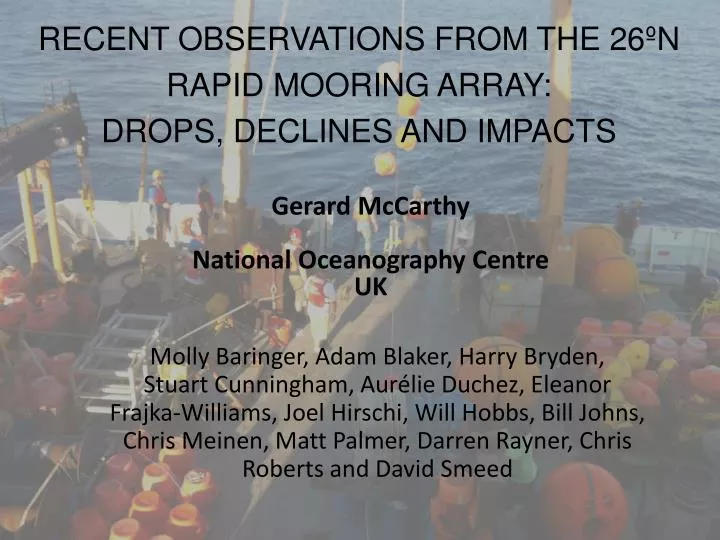
RECENT OBSERVATIONS FROM THE 26ºN RAPID MOORING ARRAY: DROPS, DECLINES AND IMPACTS. Gerard McCarthy National Oceanography Centre UK.

E N D
RECENT OBSERVATIONS FROM THE 26ºN RAPID MOORING ARRAY: DROPS, DECLINES AND IMPACTS Gerard McCarthy National Oceanography Centre UK MollyBaringer, Adam Blaker,Harry Bryden, Stuart Cunningham, AurélieDuchez, Eleanor Frajka-Williams, JoelHirschi, Will Hobbs, BillJohns, ChrisMeinen, Matt Palmer, Darren Rayner, Chris Roberts and David Smeed
INTRODUCTION • Why we study the AMOC: • Impact on climate • Evidence of major shifts in the past associated with major climate events from Rahmstorf, S. and A. Ganopolski, Long-term global warming scenarios computed with an efficient coupled climate model. Climatic Change, 1999. 43: p. 353-367.
The AMOC in a changing climate In a changing climate, the AMOC is predicted to weaken
AMOC timeseries • Data available from www.rapid.ac.uk/rapidmoc
AMOC timeseries to Oct. 2012 Double Dip Major Downturn Continued downturn? • Large downturn in 2009/10 driven by short term Ekman variability (3 months) and long term strengthening of the gyre/UMO (18 months) • Double dip in winter 2010/11 • Evidence of a decline in the AMOC from the latest timeseries
Slowdown in winter 2009/10 Ekman drop associated with negative Arctic Oscillation/NAOOnly explains 3 months of downturn Arctic Oscillation 2 s
Slowdown in winter 2009/10 Longer time scale changes: 18 month weakening of MOC Anomalously southward UMO: shift from overturning to gyre circulation McCarthy, G., et al. (2012), Observed Interannual Variability of the Atlantic Meridional Overturning Circulation at 26.5N, Geo. Res. Lett. *Seasonal cycle was removed, and data smoothed with 180-day filter
Implications for Heat Content Cunningham—next talk: The North Atlantic cooled following the downturn the thickpink curve (total predicted heat content change) would match the black curve (observed heat content change) • Cunninghamet al., Atlantic Meridional Overturning Circulation slowdown cooled the subtropical ocean submitted to GRL
Double Dip: Winter 2010/11 Double Dip: Winter 2010/11 AMOC Arctic Oscillation Second large dip in AMOC transport in winter 2010/11 following Arctic oscillation low This is largely explained by Ekman contributions Ocean re-emergence of SST links the two events Taws SL, Marsh R, Wells NC, Hirschi JJM (2011) Re-emerging ocean temperature anomalies in late-2010 associated with a repeat negative NAO. GRL
Historical Analogues of Double Dip Double Dip: Winter 2010/11 MOC Ekman AO In an ensemble of NEMO runs, double dips of MOC have occurred previously in 1969/70 and 1978/79 Extreme negative Arctic Oscillation (AO) correspond with double dip analogues Corresponds with Ekman lows • Blaker et al.; Historicalanalogues of the recent extreme minima observed in the Atlantic meridional overturning circulation at 26◦N. submitted to Clim. Dyn.
Double Dip: Implications Double Dip: Winter 2010/11 Re-emerging SSTs • Reemerging SSTs are observed in 1969/70 as well as in 2010/11 • These were conducive to the development of the negative NAO in winter 2010 • Buchan et al., North Atlantic SST anomalies and the cold north European weather events of winter 2009/10 and December 2010. accepted in Monthly Weather Review • Evidence that this second negative is predictable due to the ocean Winters of 2010/11 (green), 1969/70 (blue) and 1978/79 (red). Black shows mean (1960-2011) with 1, 2 std envelopes • Maidens et al. in prep, The Influence of Surface Forcings on Prediction of the North Atlantic Oscillation Regime of Winter 2010-11. submitted to Monthly Weather Review
MULTI-YEAR DECLINE Anomalies (positive is northward) relative to mean annual cycle. A 45-day low-pass filter was applied to each time series. Top: MOC - trend = -0.54 ± 0.45 Sv/yr Bottom: Ekman - trend = 0.00 ± 0.32 Sv/yr
MULTI-YEAR DECLINE Anomalies (positive is northward) relative to mean annual cycle. A 45-day low-pass filter was applied to each time series. Top: Gulf Stream - trend = -0.11 ± 0.32 Sv/yr Bottom: UMO - trend = -0.41 ± 0.34 Sv/yr
MULTI-YEAR DECLINE Anomalies (positive is northward) relative to mean annual cycle. A 45-day low-pass filter was applied to each time series. Top: UNADW - trend = -0.00 ± 0.26 Sv/yr Bottom: LNADW - trend = 0.46 ± 0.30 Sv/yr
MULTI-YEAR DECLINE Annual average AMOC from the 26°N array (red, Sv), estimates of the AMOC from 6 hydrographic sections (black, Sv), time series of annual average values of the AMO (blue, °C) and accumulated NAO index (green, arbitrary units).
MULTI-YEAR DECLINE Conclusions: • From April 2008 to March 2012 AMOC was 2.7 Sv weaker than from April 2004 to March 2008. • 0.2 Sv of change was due to Gulf Stream, 0.5 Sv was change in Ekman but majority (2.0 Sv) was in upper mid-ocean. • Removing the anomalous year of 2009 the reduction was 1.6 Sv. • The increase in southward flow above the thermocline was compensated by a reduction in the flow of LNADW. There was no significant change in UNADW. • The rate of slowing of LNADW was 7% per year. Observed decline of the Atlantic Meridional Overturning Circulation 2004 to 2012 Smeed, D. A., et al. Ocean Sci. Discuss., 10, 1619-645
CONCLUSIONS • Extreme Events: • A decline of 30% over 18 months in the AMOC cooled the North Atlantic in winter 2009/10 • A second dip occurred in winter 2010/11 with reemerging SSTs linking the winters • When oceanic conditions are right, two cold winters in NW Europe occur together and the second one may be predictable • Sea Level: Boston, Atlantic City, Norfolk all had peaks in sea level following extreme AMOC • Multi-Year Decline • At least a 2 Sv decline over observed period (11% in a decade) • IPCC predictions range from 11% to 34% over 21st century • Rate of decline indicates a relationship with AMO, accumulated NAO
The research leading to these results has received funding from the European Union 7th Framework Programme (FP7 2007-2013), under grant agreement n.308299 NACLIM www.naclim.eu