Download
1 / 6
70 likes | 261 Views
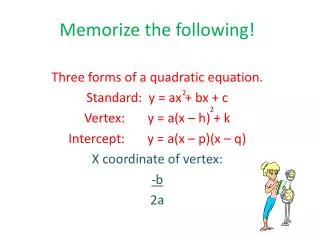
5.1 – Modeling Data with Quadratic Functions. QUADRATICS - - what are they?. Y = ax² + bx + c. FORM _______________________. Quadratic term. Linear term. Constant. Important Details c is y-intercept a determines shape and position if a > 0, then opens up

E N D
QUADRATICS - - what are they? Y = ax² + bx + c FORM _______________________ Quadratic term Linear term Constant • Important Details • c is y-intercept • a determines shape and position if a > 0, then opens up if a < 0, then opens down • Vertex: x-coordinate is at –b/2a
Parts of a parabola These are the roots Roots are also called: -zeros -solutions - x-intercepts This is the y-intercept, c It is where the parabola crosses the y-axis This is the vertex, V This is the called the axis of symmetry, a.o.s. Here a.o.s. is the line x = 2
STEPS FOR GRAPHINGY = ax² + bx +c • HAPPY or SAD ? 2 VERTEX = ( -b / 2a , f(-b / 2a) ) • T- Chart • Axis of Symmetry
GRAPHING - - Standard Form (y = ax² + bx + c) y = x² + 6x + 8 The graph will be symmetrical. Once you have half the graph, the other two points come from the mirror of the first set of points. 1) It is happy because a>0 • FIND VERTEX (-b/2a) • a =1 b=6 c=8 • So x = -6 / 2(1) = -3 • Then y = (-3)² + 6(-3) + 8 = -1 • So V = (-3 , -1) 3) T-CHART X Y = x² + 6x + 8 Why -2 and 0? Pick x values where the graph will cross an axiw -2 • y = (-2)² + 6(-2) + 8 = 0 0 • y = (0)² + 6(0) + 8 = 8
GRAPHING - - Standard Form (y = ax² + bx + c) y = -x² + 4x - 5 1) It is sad because a<0 • FIND VERTEX (-b/2a) • a =-1 b=4 c=-5 • So x = - 4 / 2(-1) = 2 • Then y = -(2)² + 4(2) – 5 = -1 • So V = (2 , -1) Here we only have one point where the graph will cross an axis. Choose one other point (preferably between the vertex and the intersection point) to graph. 3) T-CHART X Y = -x² + 4x - 5 1 • y = -(1)² + 4(1) - 5 = -2 0 • y = -(0)² + 4(0) – 5 = -5