Download
1 / 147
1.47k likes | 1.61k Views
Modeling with Observational Data. Michael Babyak, PhD. What is a model ?. Y = f(x1, x2, x3…xn). Y = a + b1x1 + b2x2…bnxn. Y = e a + b1x1 + b2x2…bnxn. “All models are wrong, some are useful” -- George Box. A useful model is Not very biased Interpretable

E N D
Modeling with Observational Data Michael Babyak, PhD
What is a model ? Y = f(x1, x2, x3…xn) Y = a + b1x1 + b2x2…bnxn Y = e a + b1x1 + b2x2…bnxn
“All models are wrong, some are useful” -- George Box • A useful model is • Not very biased • Interpretable • Replicable (predicts in a new sample)
Some Premises • “Statistics” is a cumulative, evolving field • Newer is not necessarily better, but should be entertained in the context of the scientific question at hand • Data analytic practice resides along a continuum, from exploratory to confirmatory. Both are important, but the difference has to be recognized. • There’s no substitute for thinking about the problem
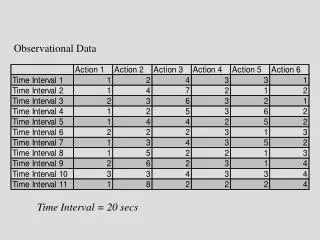
Observational Studies • Underserved reputation • Especially if conducted and analyzed ‘wisely’ • Biggest threats • “Third Variable” • Selection Bias (see above) • Poor Planning
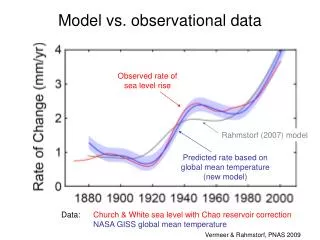
Correlation between results of randomized trials and observational studieshttp://www.epidemiologic.org/2006/11/agreement-of-observational-and.html
Statistics is a cumulative, evolving field: How do we know this stuff? • Theory • Simulation
Concept of Simulation Y = b X + error bs1 bs2 bsk-1 bsk bs3 bs4 ………………….
Concept of Simulation Y = b X + error bs1 bs2 bsk-1 bsk bs3 bs4 …………………. Evaluate
Simulation Example Y = .4 X + error bs1 bs2 bsk-1 bsk bs3 bs4 ………………….
Simulation Example Y = .4 X + error bs1 bs2 bsk-1 bsk bs3 bs4 …………………. Evaluate
Ingredients of a Useful Model Correct probability model Based on theory Good measures/no loss of information Useful Model Comprehensive Parsimonious Tested fairly Flexible
Correct Model • Gaussian: General Linear Model • Multiple linear regression • Binary (or ordinal): Generalized Linear Model • Logistic Regression • Proportional Odds/Ordinal Logistic • Time to event: • Cox Regression or parametric survival models
Generalized Linear Model Normal Binary/Binomial Count, heavy skew, Lots of zeros Poisson, ZIP, negbin, gamma General Linear Model/ Linear Regression Logistic Regression ANOVA/t-test ANCOVA Chi-square Regression w/ Transformed DV Can be applied to clustered (e.g, repeated measures data)
Factor Analytic Family Structural Equation Models Partial Least Squares Latent Variable Models (Confirmatory Factor Analysis) Multiple regression Common Factor Analysis Principal Components
Use Theory • Theory and expert information are critical in helping sift out artifact • Numbers can look very systematic when the are in fact random • http://www.tufts.edu/~gdallal/multtest.htm
Measure well • Adequate range • Representative values • Watch for ceiling/floor effects
Using all the information • Preserving cases in data sets with missing data • Conventional approaches: • Use only complete case • Fill in with mean or median • Use a missing data indicator in the model
Missing Data • Imputation or related approaches are almost ALWAYS better than deleting incomplete cases • Multiple Imputation • Full Information Maximum Likelihood
Modern Missing Data Techniques • Preserve more information from original sample • Incorporate uncertainty about missingness into final estimates • Produce better estimates of population (true) values
Don’t waste information from variables • Use all the information about the variables of interest • Don’t create “clinical cutpoints” before modeling • Model with ALL the data first, then use prediction to make decisions about cutpoints
Dichotomizing for Convenience = Dubious Practice(C.R.A.P.*) • Convoluted Reasoning and Anti-intellectual Pomposity • Streiner & Norman: Biostatistics: The Bare Essentials
Implausible measurement assumption “not depressed” “depressed” A B C Depression score
Loss of power http://psych.colorado.edu/~mcclella/MedianSplit/ Sometimes through sampling error You can get a ‘lucky cut.’ http://www.bolderstats.com/jmsl/doc/medianSplit.html
Dichotomization, by definition, reduces the magnitude of the estimate by a minimum of about 30% Dear Project Officer, In order to facilitate analysis and interpretation, we have decided to throw away about 30% of our data. Even though this will waste about 3 or 4 hundred thousand dollars worth of subject recruitment and testing money, we are confident that you will understand. Sincerely, Dick O. Tomi, PhD Prof. Richard Obediah Tomi, PhD
Power to detect non-zero b-weight when x is continuous versus dichotomized True model: y =.4x + e
Dichotomizing will obscure non-linearity Low High CESD Score
Dichotomizing will obscure non-linearity: Same data as previous slide modeled continuously
Type I error rates for the relation between x2 and y after dichotomizing two continuous predictors.Maxwell and Delaney calculated the effect of dichotomizing two continuous predictors as a function of the correlation between them. The true model is y = .5x1 + 0x2, where all variables are continuous. If x1 and x2 are dichotomized, the error rate for the relation between x2 and y increases as the correlation between x1 and x2 increases.
Is it ever a good idea to categorize quantitatively measured variables? • Yes: • when the variable is truly categorical • for descriptive/presentational purposes • for hypothesis testing, if enough categories are made. • However, using many categories can lead to problems of multiple significance tests and still run the risk of misclassification
CONCLUSIONS • Cutting: • Doesn’t always make measurement sense • Almost always reduces power • Can fool you with too much power in some instances • Can completely miss important features of the underlying function • Modern computing/statistical packages can “handle” continuous variables • Want to make good clinical cutpoints? Model first, decide on cuts afterward.
Statistical Adjustment/Control • What does it mean to ‘adjust’ or ‘control’ for another variable?
Y 2