Download
1 / 27
270 likes | 411 Views
1. Temperature trends in IPCC 20 th century runs v. radiosondes 2. Volcanic signals 3. Effects of volcanic eruptions on trends? Melissa Free John Lanzante. 6 models from 4 modeling centers: # runs Geophysical Fluid Dynamics Lab GFDL2.0 3 GFDL2.1 3

E N D
1. Temperature trends in IPCC 20th century runs v. radiosondes 2. Volcanic signals 3. Effects of volcanic eruptions on trends? Melissa Free John Lanzante
6 models from 4 modeling centers: # runs Geophysical Fluid Dynamics Lab GFDL2.0 3 GFDL2.1 3 Goddard Institute for Space Studies GISS ER* 9 GISS EH* 5 Hadley Centre HadGEM 1 NCAR PCM 4 Simulations starting in 19th century, all forced with solar, volcanic, ozone, greenhouse gas changes and direct sulfate effects. (Models differ on details and some include other forcings.) * ozone forcing was wrong
Quantifying the comparison • Correlations between vertical profiles of trends, • model v. observations (100-30 mb) • Differences between stratospheric mean trends • Compare results for adjusted and unadjusted data
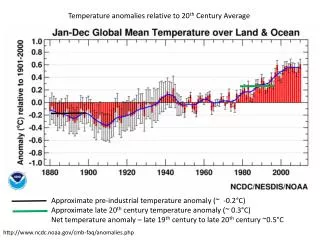
Tropical stratosphere— • Sonde data agrees with GFDL models for 1960-1999, but is too cool for 1979-1999. • Differences are larger at 100 mb than above. • PCM has different shape than data for extratropics (79-99) • Homogeneity adjustments generally improve model-data trend agreement.
Pinatubo zonal mean response K K Mean of models RATPAC observations QBO and ENSO removed from data, ENSO removed from models. Mean of 24 months after minus mean of 24 months before.
Volcanic effect, 30N-30S ENSO and QBO removed
Volcanic signal NH Extratropics
Volcanic signal, SH extratropics SH Extratropics
(RATPAC) K/decade
Effect of eruptions on temperature trends Method based on Santer et al. (2001) 1. Find lowest temperature within 24 months after eruption. 2. Construct volcanic signal assuming linear ramp down to minimum, followed by exponential decay 3. Remove this signal from time series 4. Find difference in trends
1979-2005 Trend = - 0.16 K/dec
Models tend to overestimate stratospheric warming, especially after Pinatubo—especially PCM. Biggest differences are at 100 mb for Pinatubo. Dropping 2 years after eruptions is not an accurate method to estimate effects on trends. Santer method also has large uncertainties. Preliminary results suggest effects of eruptions on stratospheric trends are order 0.15 K/decade or less, small in comparison to the trends (work is still in progress).