Download
1 / 9
90 likes | 144 Views
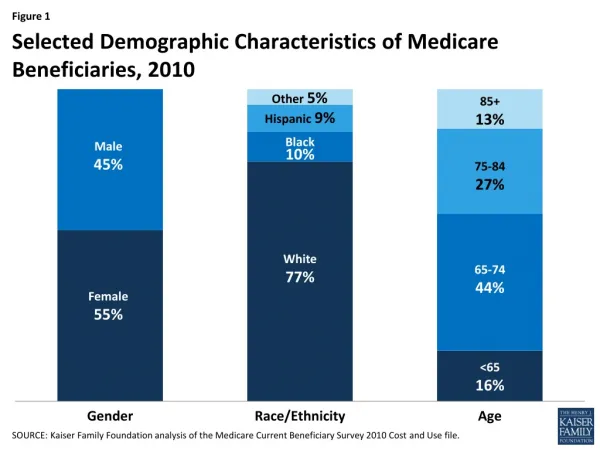
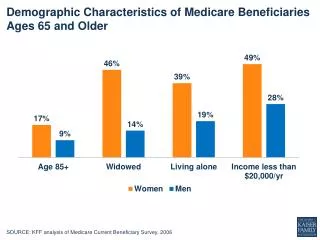
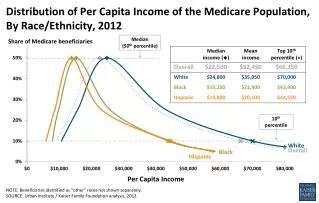
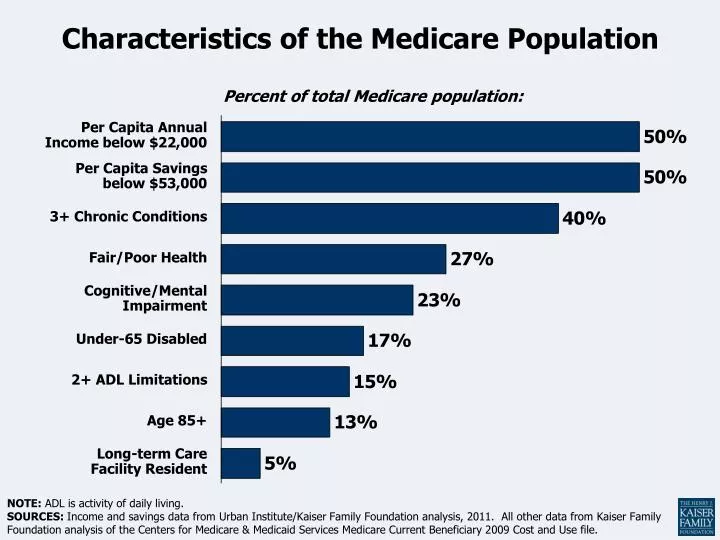
Characteristics of the Medicare Population. Percent of total Medicare population:.

E N D
Characteristics of the Medicare Population Percent of total Medicare population: NOTE: ADL is activity of daily living. SOURCES: Income and savings data from Urban Institute/Kaiser Family Foundation analysis, 2011. All other data from Kaiser Family Foundation analysis of the Centers for Medicare & Medicaid Services Medicare Current Beneficiary 2009 Cost and Use file.
Distribution of Traditional Medicare Beneficiaries and Medicare Spending, 2009 Average per capita Traditional Medicare spending: $9,702 Average per capita Traditional Medicare spending among top 10%: $55,763 Average per capita Traditional Medicare spending among bottom 90%: $4,584 Total Number of Traditional Medicare Beneficiaries: 35.4 million Total Traditional Medicare Spending: $343 billion NOTES: Excludes Medicare Advantage enrollees. Includes noninstitutionalized and institutionalized beneficiaries. SOURCE: Kaiser Family Foundation analysis of the CMS Medicare Current Beneficiary Survey Cost and Use File, 2009.
Medicare Beneficiaries’ Utilization of Selected Medical and Long-Term Care Services, 2009 Percent of total Medicare population: SOURCES: Kaiser Family Foundation analysis of the Centers for Medicare & Medicaid Services Medicare Current Beneficiary 2009 Cost and Use file.
Medicare Benefit Payments By Type of Service, 2012 Part A Part B Part A and B Part C Part D 11% 26% 22% 6% 14% 13% 6% 4% Total Benefit Payments = $556 billion NOTE: Does not sum to 100% due to rounding. Excludes administrative expenses and is net of recoveries. *Includes hospice, durable medical equipment, Part B drugs, outpatient dialysis, ambulance, lab services, and other services.SOURCE: Congressional Budget Office, Medicare Baseline, March 2012.
Part B and Part D Out-of-Pocket Spending as a Share of Average Social Security Benefit Total SMIout-of-pocket spending Average out-of-pocket spending on SMI cost sharing 2020: 27% 2010: 26% 2000: 14% Average out-of-pocket spending on SMI premiums NOTE: SMI is Supplementary Medical Insurance. Out-of-pocket spending includes SMI (Part B and Part D) premiums and out-of-pocket cost-sharing expenses for SMI covered services. SOURCE: Kaiser Family Foundation analysis based on data from 2012 Annual Report of the Boards of Trustees of the Federal Hospital Insurance and Federal Supplementary Medical Insurance Trust Funds.
Medicare as a Share of the Federal Budget, 1980 - 2020 SOURCE: Historical spending for 1980 – 2010 from Congressional Budget Office (CBO) Budget and Economic Outlook: Historical Budget Data (January 2011); projected spending for 2020 from CBO Update to the Budget and Economic Outlook: Fiscal Years 2012 to 2022 (August 2012).
Average Annual Growth in Medicare Spending Compared with Economic Benchmarks, 2011 – 2020 NOTE: SGR is sustainable growth rate; GDP is gross domestic product; CPI is consumer price index. SOURCES: Kaiser Family Foundation analysis of data from Medicare Trustees, Office of Management and Budget, Congressional Budget Office, Centers for Medicare & Medicaid Services, U.S. Census Bureau.
Medicare Enrollment, 1970 - 2030 Number in millions: Historical Projected SOURCE: 2012 Annual Report of the Boards of Trustees of the Federal Hospital Insurance and Federal Supplementary Medical Insurance Trust Funds.
Solvency Projections of the Medicare Part A Trust Fund under current law and with repeal of health reform law Solvency projections of the Part A trust fund: Year Source: Part A solvency projection for current law from 2012 Annual Report of the Boards of Trustees of the Federal Hospital Insurance and Federal Supplementary Medical Insurance Trust Funds; solvency projection with ACA repeal from Centers for Medicare and Medicaid Services (CMS) Press Release, “Medicare Stable, but Requires Strengthening,” released April 23, 2012.