Download
1 / 22
220 likes | 376 Views
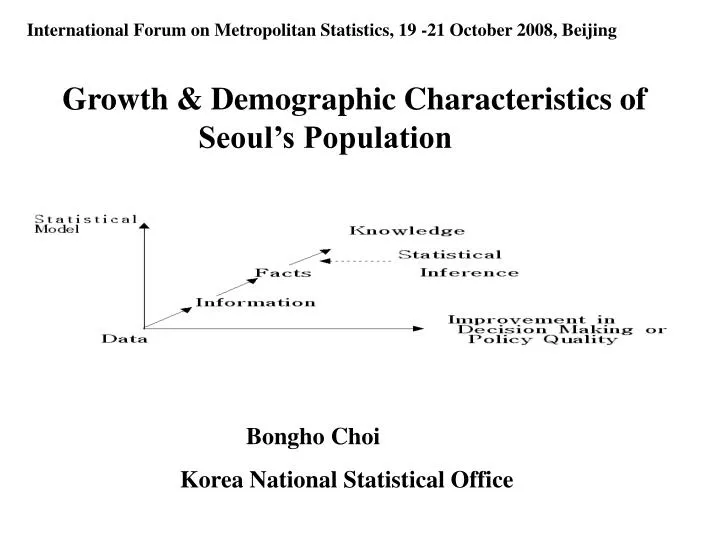
International Forum on Metropolitan Statistics, 19 -21 October 2008, Beijing. Growth & Demographic Characteristics of Seoul’s Population. Bongho Choi Korea National Statistical Office. Urban Population and Contribution of Net Migration.

E N D
International Forum on Metropolitan Statistics, 19 -21 October 2008, Beijing Growth & Demographic Characteristics of Seoul’s Population Bongho Choi Korea National Statistical Office
Regional Statistics Needed: Example of Australian Bureau of Statistics • Demography(size & structure of population, migration) • Quality of Life - Services(demand, availability, accessibility, affordability, quality) - Well-being (employment, health, housing, income, assets) - Specific population groups (foreign laborers, youth, older persons, women, persons with a disability) • Community Strength - Human capital (education, skills, leadership, training infrastructure) - Social capital (social networks, community activities, trust, safety, sense of belonging) - Information networks • Economic Growth -Structure (industry, labor market, turnover, journey to work) - Performance(production, consumption, turnover, employment, investment, income and earnings) -Links (imports, exports) - Barriers (labor force skills, infrastructure, innovation, environment) • Environmental Issues
Regional Statistics Needed: Example of Statistics New Zealand
Regional Statistics Needed: Example of Statistics New Zealand
e – indicators for local governmentshttp://jibang.kosis.kr
How each indicator is represented Graphs Tables of Statistics Explanations & analyses - definition - how to interpret it - trends - main influencing factors - future expectation Remarks, Terms and method Posted opinions or comments 5
Statistics Why did KNSO develop this system? ★All Local Government Agencies need Good Statistics to tell the current status - how we are doing to show the direction we should go ★ Good statistics provide evidences for good policy processing help governments to identify the best courses of action in dealing with complex situations 1
Q & A Thank you !!