Download
1 / 14
140 likes | 297 Views
Jeanne. Frances. Hurricane Frances Landfall on September 5 th Customers affected Poles replaced Transformers replaced Miles of wire replaced Personnel involved. 2,786,300 3,800 3,000 550 16,700. Hurricane Charley Landfall on August 13 th Customers affected

E N D
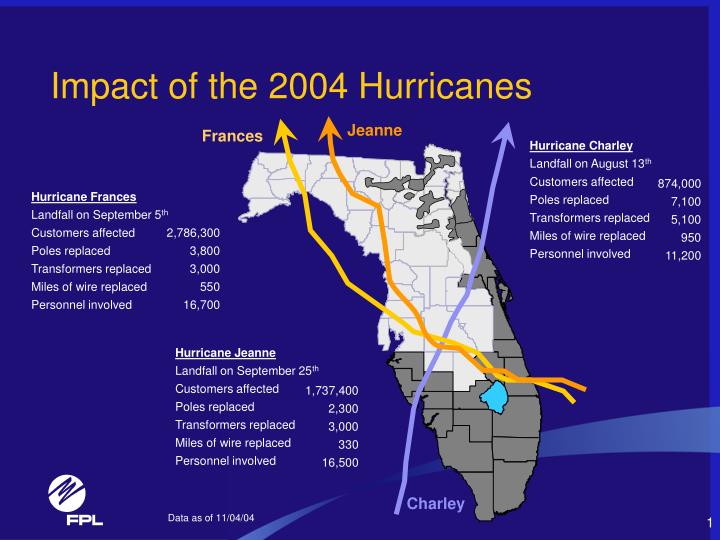
Jeanne Frances Hurricane Frances Landfall on September 5th Customers affected Poles replaced Transformers replaced Miles of wire replaced Personnel involved 2,786,300 3,800 3,000 550 16,700 Hurricane Charley Landfall on August 13th Customers affected Poles replaced Transformers replaced Miles of wire replaced Personnel involved 874,000 7,100 5,100 950 11,200 Hurricane Jeanne Landfall on September 25th Customers affected Poles replaced Transformers replaced Miles of wire replaced Personnel involved 1,737,400 2,300 3,000 330 16,500 Charley Impact of the 2004 Hurricanes Data as of 11/04/04
Oct 4th Aug 10th Aug 27th Sept 17th Charley Frances Jeanne 13 Days 12 Days 8 Days 72 Hour Preparation Storm Impact Restoration Period A 56-day Storm Schedule(For illustrative purposes)
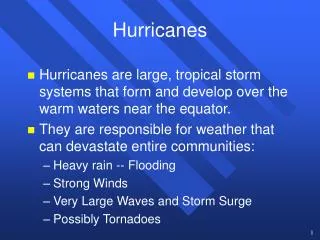
Hurricane force winds Tropical storm force winds Characteristics of Charley • Category 4 – winds 140 mph • Hurricane force winds - 60 miles wide • Tropical storm force winds - 210 miles wide • Bicoastal event with severe damage in portions of west coast area • Moved quickly across state – hours of impact 20 • Exited state as a Category 1
Characteristics of Frances • Category 2 – winds 105 mph • Hurricane force winds – 145 miles wide • Tropical storm force winds – 345 miles wide • Affected whole FPL service territory • Widespread but not severe damage • Very slow moving - hours of impact 60 Hurricane force winds Tropical storm force winds
Hurricane force winds Tropical storm force winds Characteristics of Jeanne • Category 3 – winds 120 mph • Hurricane force winds - 125 miles wide • Tropical storm force winds – 315 miles wide • Medium damage to central area and east coast • Pockets of severe damage • Moved up the state - hours of impact 45
Approximate Damage to Infrastructure 1 Represents power unit impact, forced offline 2 Plant taken offline, represents damage to overall facility
Progress during Restoration Jeanne Frances Charley 90% of customers affected by Charley restored by the 5th day 92% of customers affected by Frances restored by the 7th day 93% of customers affected by Jeanne restored by the 5th day
Peak Energy Use, System wide: Summer July 14, 2004 20,545 MW Winter Jan 24, 2003 20,190 MW FPL Service Area
Scherer (SOU) St. Johns Putnam • Generating Units: 37 Nuclear 4 units 2,939 MW Fossil 33 units 14,183 MW Peaking Units 1,934 MW Purchased Power 3,141 MW • Total Generating Capability1: 22,197 MW Sanford Cape Canaveral Manatee St Lucie Martin Rivera Ft Myers FPL Generators Port Everglades Cutler T. Point 1 as of 12/31/03
FPL Power Supply1 • Number of Substations: 529 • Miles of Transmission Lines: 500kV 1,105 230kV 2,350 138kV 1,456 115kV 671 69kV 164 Total Transmission Miles 5,746 miles Everglades 1 as of 12/31/03
FPL CONTROL CENTERS DAYTONA DISPATCH OFFICE (DISTRIBUTION) SARASOTA DISPATCH OFFICE (DISTRIBUTION) WEST PALM DISPATCH OFFICE (DISTRIBUTION) SOUTH FLA DISPATCH OFFICE (DISTRIBUTION) SYSTEM CONTROL CENTER GOCC