Download
1 / 23
230 likes | 293 Views
Orographically Induced Cirrus Clouds East of the Southern Appalachian Mountains. Ryan Ellis NOAA/NWS Raleigh, NC. Motivation.

E N D
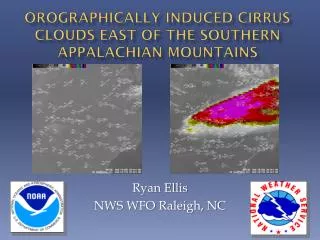
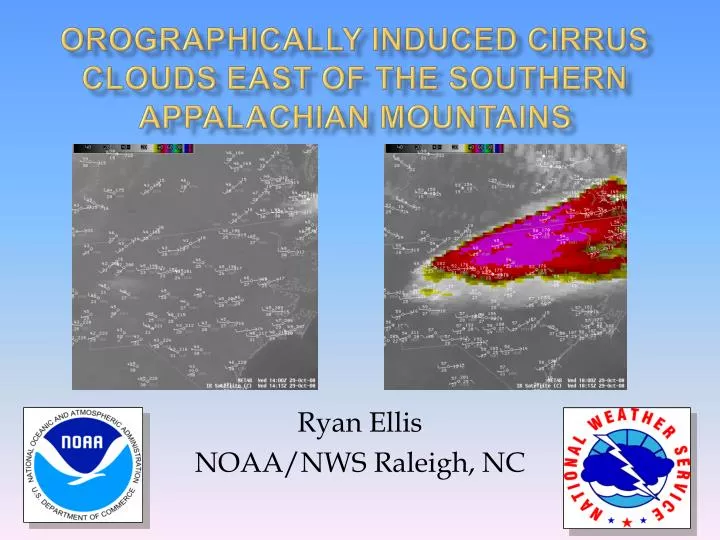
Orographically Induced Cirrus Clouds East of the Southern Appalachian Mountains Ryan Ellis NOAA/NWS Raleigh, NC
Motivation • The development of orographically induced cirrus clouds east of the southern Appalachian Mountain chain can result in areas of unanticipated cloudiness downstream across the Carolinas and Virginia. • Both the degree of cloudiness and its impact on surface temperatures can have an adverse effect on forecast accuracy. • The general environmental conditions favorable for orographic cirrus development are known and have been qualitatively documented, but to this point have not been extensively quantified. • This study will attempt to quantify the conditions necessary for orographic cirrus development across the southern Appalachian Mountains.
Data • 40 unique cases of orographic cirrus were observed along the Southern Appalachians on 24 calendar days from March 2009 through February 2010. • The case study shown from October 2008 is not included in the composite data.
500 mbGeopotential Height The synoptic setup for an orographic cirrus event is characterized by a strong low pressure system to the northeast with ridging to the west.
GSO Composite Sounding Composite sounding for all GSO events shows indicates an inversion between 850 and 700 mb. Averaging accounts for loss of inversion strength detail in this figure.
Wind Vectors 300 mb vector winds on the left with 700 mb winds on the right. During an orographic cirrus event, winds are unidirectional or backing slightly from the top of the inversion to the tropopause while increasing with height.
Wind Rose Wind roses also depicting winds backing and increasing with height. This figure also shows that orographic cirrus events almost exclusively feature northwesterly winds.
500 mb Relative Humidity 500 mb relative humidity shows a strong RH gradient along the Appalachians indicating an upstream moisture source.
Case Study 10/29/08 IR satellite pictures showing conditions before a cirrus outbreak, and after the onset, just four hours later.
Satellite Imagery Visible and water vapor imagery depicting the 10/29 outbreak. A fetch of moisture can be seen upstream of the cirrus. Areas of enhanced moisture can be seen in the flow. These are believed to act as catalysts in setting off an event like the one shown.
500 mbGeopotential Height 500 mb geopotential height pattern for 10/29/08 showing a typical setup for orographic cirrus including the low centered over New England and a strong ridge to the west.
GSO Sounding GSO sounding for 10/28 showing the main inversion from about 850mb to 800 mb with a secondary inversion and near isothermal layer above. Winds are backing slightly with height and increasing in speed up to the tropopause.
Cross Section A zero hour RUC analysis depicting the cirrus in the 300-250 mb layer. Omega (yellow) shows strong upward forcing on the lee side of the ridge to west of the cirrus.
Surface Temperatures Observed temperatures have differed from forecasted values by as much as 10 degrees in the presence of orographic cirrus.
Conclusions • Orographic cirrus outbreaks can affect temperature forecasts by as much as 10˚F. • Outbreak events usually set up in a stable environment with a mid to upper level low pressure system to the northeast and a strong upper level ridge to the west. • An inversion typically exists between 850 and 700 millibars. • Winds are generally unidirectional from the northwest with some slight backing throughout the profile from the top of the inversion to the tropopause. • A pre-existing upstream moisture source is usually necessary to trigger the onset of an orographic cirrus outbreak.
Conditions Favorable for Vertically Propagating Mountain Wave Cloudiness across the Mid Atlantic • A deep layer of nearly unidirectional flow across the higher terrain (from 270 to 030 degrees) from mountain top level (850 mb or 5,000 ft) upward • A pronounced stable layer, approaching isothermal or even inversion, at or above mountain top level (850 mb or 5,000 ft) with increasing wind speed with height through the layer. Winds should exceed 30 kts at 700 mb or 10,000 ft. • Upstream moisture at altocumulus or cirrus level (above 10,000 feet or 700 mb) which can be found on water vapor imagery and in upstream roabs (KPIT,KILN, KILX, or KBNA) • These clouds typically develop during the nighttime hours (00Z-09Z) and can persist through the morning to early afternoon hours (09Z-18Z) • Synoptic pattern is typically a cool season or transitional season phenomena. October 29, 2008 Example A strong cyclonic flow was present at mid and upper levels over the Mid Atlantic and Northeast. A jet streak with an area of enhanced moisture but little cloudiness rotated southeast across the southern Appalachians. The wind and thermal pattern supported the development of vertically propagating mountain waves which interacted with the region of enhanced moisture and resulted in a shield of orographic cirrus clouds. KGSO RAOB water vapor sat imagery IR sat imagery
Future Work • In the future we would like to attempt to compile verification statistics for temperature and cloud cover data during orographic cirrus outbreaks. • We would also like to develop an improved reference and an AWIPS procedure for predicting orographic cirrus events in the Mid-Atlantic region.
References • Durran, D. R., 1986: Mountain waves. In: Ray PS (eds) Mesoscale meteorology and forecasting. American Meteorological Society,Boston, pp 472–492. • Ellrod, G., 1983: “Orographic Cirrus Along the Appalachian Mountains,” Satellite Applications Information Note; 83/2. • Gonski, R., 1999: Forecasting Orographic Cloudiness in North Carolina. Local NWS Raleigh training document. • NOAA, 2004: Mountain Waves and Downslope Winds. COMET module, University Corporation of Atmospheric Research, National Center for Atmospheric research, Boulder, CO.