Download
1 / 1
10 likes | 138 Views
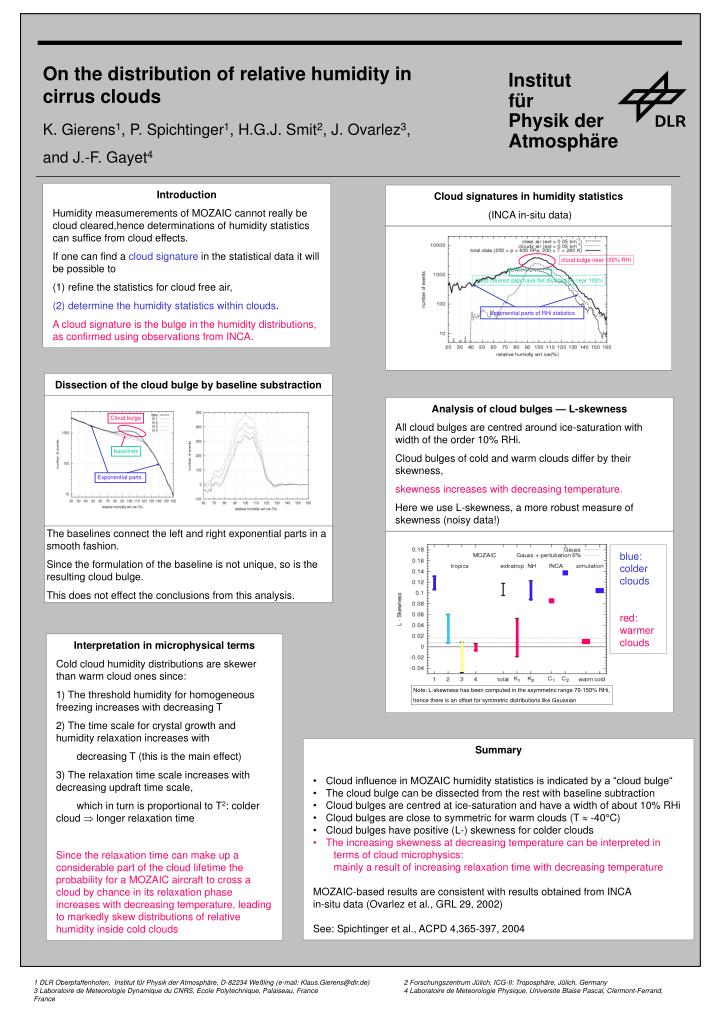
cloud bulge near 100% RHi. cloud cleared data have flat distribution near 100%. Exponential parts of RHi statistics. Cloud bulge. baselines. Exponential parts. Institut für Physik der Atmosphäre. K. Gierens 1 , P. Spichtinger 1 , H.G.J. Smit 2 , J. Ovarlez 3 , and J.-F. Gayet 4.

E N D
cloud bulge near 100% RHi cloud cleared data have flat distribution near 100% Exponential parts of RHi statistics Cloud bulge baselines Exponential parts Institut für Physik der Atmosphäre K. Gierens1, P. Spichtinger1, H.G.J. Smit2, J. Ovarlez3, and J.-F. Gayet4 On the distribution of relative humidity incirrus clouds Introduction Humidity measumerements of MOZAIC cannot really be cloud cleared,hence determinations of humidity statistics can suffice from cloud effects. If one can find a cloud signature in the statistical data it will be possible to (1) refine the statistics for cloud free air, (2) determine the humidity statistics within clouds. A cloud signature is the bulge in the humidity distributions, as confirmed using observations from INCA. Cloud signatures in humidity statistics (INCA in-situ data) Dissection of the cloud bulge by baseline substraction Analysis of cloud bulges — L-skewness All cloud bulges are centred around ice-saturation with width of the order 10% RHi. Cloud bulges of cold and warm clouds differ by their skewness, skewness increases with decreasing temperature. Here we use L-skewness, a more robust measure of skewness (noisy data!) The baselines connect the left and right exponential parts in a smooth fashion. Since the formulation of the baseline is not unique, so is the resulting cloud bulge. This does not effect the conclusions from this analysis. blue: colder clouds red: warmer clouds Interpretation in microphysical terms Cold cloud humidity distributions are skewer than warm cloud ones since: 1) The threshold humidity for homogeneous freezing increases with decreasing T 2) The time scale for crystal growth and humidity relaxation increases with decreasing T (this is the main effect) 3) The relaxation time scale increases with decreasing updraft time scale, which in turn is proportional to T2: colder cloud longer relaxation time Since the relaxation time can make up a considerable part of the cloud lifetime the probability for a MOZAIC aircraft to cross a cloud by chance in its relaxation phase increases with decreasing temperature, leading to markedly skew distributions of relative humidity inside cold clouds Note: L-skewness has been computed in the asymmetric range 70-150% RHi, hence there is an offset for symmetric distributions like Gaussian • Summary • Cloud influence in MOZAIC humidity statistics is indicated by a “cloud bulge“ • The cloud bulge can be dissected from the rest with baseline subtraction • Cloud bulges are centred at ice-saturation and have a width of about 10% RHi • Cloud bulges are close to symmetric for warm clouds (T -40°C) • Cloud bulges have positive (L-) skewness for colder clouds • The increasing skewness at decreasing temperature can be interpreted in • terms of cloud microphysics: • mainly a result of increasing relaxation time with decreasing temperature • MOZAIC-based results are consistent with results obtained from INCA • in-situ data (Ovarlez et al., GRL 29, 2002) • See: Spichtinger et al., ACPD 4,365-397, 2004 1 DLR Oberpfaffenhofen, Institut für Physik der Atmosphäre, D-82234 Weßling (e-mail: Klaus.Gierens@dlr.de) 2 Forschungszentrum Jülich, ICG-II: Troposphäre, Jülich, Germany 3 Laboratoire de Meteorologie Dynamique du CNRS, Ecole Polytechnique, Palaiseau, France 4 Laboratoire de Meteorologie Physique, Universite Blaise Pascal, Clermont-Ferrand, France