Download
1 / 27
270 likes | 396 Views
Atmospheric Modeling for the Southern Appalachian Mountains Initiative (SAMI). Talat Odman Air Resources Engineering Center Georgia Institute of Technology Southern Section A&WMA Annual Conference August 9, 2001. SAMI Modeling Project. Objective :

E N D
Atmospheric Modeling for the Southern Appalachian Mountains Initiative (SAMI) Talat Odman Air Resources Engineering Center Georgia Institute of Technology Southern Section A&WMA Annual Conference August 9, 2001 Georgia Institute of Technology
SAMI Modeling Project • Objective: To assess the impact of regional control strategies on • Ozone (seasonal) • PM/visibility (annual) • Acid deposition (annual) in Class I areas of the Southern Appalachian Mountains • Approach: Using a “one-atmosphere” modeling approach, simulate nine episodes that represent a typical season/year July 11 -19, 1995 July 23 - 31, 1991 May 24 -29, 1995 May 11 -17, 1993 March 23 -31, 1993 February 8 - 13, 1994 August 3 - 11, 1991 June 24 - 29, 1992 April 26 - May 3, 1995 Georgia Institute of Technology
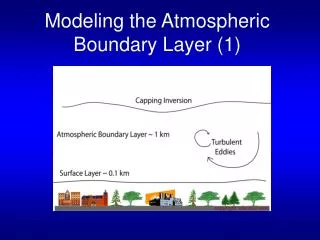
Modeling System • Meteorology: Regional Atmospheric Modeling System (RAMS) • Nonhydrostatic; nested grids • Cloud and rain water activity only (no ice microphysics) • NCEP reanalysis data for initialization and nudging • Near the mountains, nudging of surface moisture only • Emissions: Emission Modeling System (EMS-95) • Generates gridded, time varying and speciated emission inputs • MOBILE 5b highway vehicle emission factor model • BEIS2 biogenic emissions model (uses modeled temperature) • Air Quality: Urban-to-Regional Multiscale model (URM) • 3-D Eulerian photochemical model Georgia Institute of Technology
URM Model • Transport: • SUPG finite element transport scheme (Odman & Russell, 1991) • K-theory diffusion • Chemistry: • SAPRC-93 gas-phase chemistry mechanism (Carter, 1994) • Aqueous-phase heterogeneous sulfate chemistry • Deposition: • Dry: Three-resistance approach (Wesely, 1989) • Wet: Reactive Scavenging Module (RSM) (Berkowitz, et al., 1989) • Aerosol dynamics: • Sectional approach (Gelbard and Seinfeld, 1980) • ISORROPIA thermodynamic equilibrium (Nenes, et al., 1998) • Organic aerosol yields (Pandis, et al., 1992) Georgia Institute of Technology
Aerosol Module • Inorganic aerosols - ISORROPIA • sulfate, nitrate, ammonium, chloride, sodium, hydrogen ion • condensation/evaporation (thermodynamic equilibrium) • Organic aerosols • experimental and estimated aerosol yields from VOC oxidation • Inert Species • EC, Mg, Ca, K, other PM • Sectional Size Distribution Georgia Institute of Technology
SAMI Modeling Domain and Grid Georgia Institute of Technology
Ozone at South DeKalb, GA (11-19 July 1995) Georgia Institute of Technology
Ozone at Look Rock, TN (11-19 July 1995) Georgia Institute of Technology
Ozone Bias • Daily average normalized bias • All AIRS sites within 12 km resolution • 40 ppb cutoff Georgia Institute of Technology
PM2.5 Performance on July 15, 1995 Georgia Institute of Technology
PM2.5 Performance at GRSM & SHEN Georgia Institute of Technology
Sulfate Aerosol Performance Georgia Institute of Technology
PM2.5 Performance Summary Georgia Institute of Technology
SO4 Wet Deposition Performance Georgia Institute of Technology
Wet Deposition Performance Summary Georgia Institute of Technology
2010 OTW Emission Assumptions • Reductions to comply with 1-hr ozone standard in eastern U.S. • NOx and SO2 reductions from utility sources under Title IV • NOx and VOC reductions from mobile sources under Tier 1 & 2 • NOx reductions from SIP calls • VOC reductions resulting from MACT • SO2 reduced by 28% • NOx reduced by 31% • NH3 increased by 38% Georgia Institute of Technology
Ozone in 1995 & Projected Change in 2010 Georgia Institute of Technology
1995 and 2010 Ozone at GSM GSM - July 1995 0.090 0.080 0.070 Ozone (ppm) 0.060 0.050 0.040 0.030 11 12 13 14 15 16 17 18 19 20 O3_1995 O3_2010-OTB O3_2010-OTW Georgia Institute of Technology
Sulfate Aerosol in 1995 & Projected Change in 2010 Georgia Institute of Technology
Sulfate decreased by 11% Nitrate increased by 34% Ammonium increased by 4% Organics decreased by 1% Sulfate decreased by 22% Nitrate decreased by 11% Ammonium decreased by 11% Organics decreased by 4% Georgia Institute of Technology
Sulfate Wet Deposition in 1995 & Projected Change in 2010 Georgia Institute of Technology
Sensitivity Analysis • Brute-Force method • Brute Force shows the difference in concentrations between 2 model runs with different emissions • Must run the model a number of different times • Inaccurate sensitivities may result due to numerical noise propagating in the model • DDM - Decoupled Direct Method • Use direct derivatives of governing equations • sij=ci/pj • Perform numerous sensitivity calculations in one model run. • Inaccurate sensitivities may result due to non-linear response Georgia Institute of Technology
Sulfate Sensitivity to SO2 Emissions Georgia Institute of Technology
Sensitivity Regions Georgia Institute of Technology
2010-OTW Midwest Northeast SAMI Central Southeast SO4 & its Change on July 15, 1995 for a 10% Reduction of 2010-OTW SO2 Emissions from Different Regions Georgia Institute of Technology
KY WV VA SO4 & its Change on July 15, 1995 for a 10% Reduction of 2010-OTW SO2 Emissions from SAMI States TN 2010-OTW NC AL GA SC Georgia Institute of Technology
Summary • Developed a “one atmosphere” air quality model • Applying to the eastern United States • Class I areas of the Southern Appalachian Mountains • Evaluated results against monitoring databases • Simulated future air quality to determine the most effective emission control strategies • Three emission control strategies for 2010 and 2040 • Performing sensitivity analysis • Source-receptor relationships by state • SO2, elevated point NOx, ground-level NOx, NH3 emissions • http://environmental.gatech.edu/SAMI Georgia Institute of Technology