Download
1 / 82
990 likes | 1.49k Views
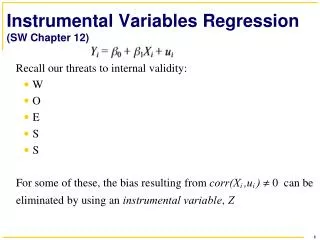
Chapter 12 Regression with Time-Series Data: Nonstationary Variables. Walter R. Paczkowski Rutgers University. Chapter Contents. 12.1 Stationary and Nonstationary Variables 12.2 Spurious Regressions 12 .3 Unit Root Tests for Nonstationarity 12 .4 Cointegration

E N D
Chapter 12 Regression with Time-Series Data: Nonstationary Variables Walter R. Paczkowski Rutgers University
Chapter Contents • 12.1 Stationary and Nonstationary Variables • 12.2 Spurious Regressions • 12.3 Unit Root Tests for Nonstationarity • 12.4 Cointegration • 12.5 Regression When There Is No Cointegration
The aim is to describe how to estimate regression models involving nonstationary variables • The first step is to examine the time-series concepts of stationarity (and nonstationarity) and how we distinguish between them. • Cointegration is another important related concept that has a bearing on our choice of a regression model
12.1 Stationary and Nonstationary Variables
12.1 Stationary and Nonstationary Variables • The change in a variable is an important concept • The change in a variable yt, also known as its first difference, is given by Δyt = yt – yt-1. • Δyt is the change in the value of the variable y from period t - 1 to period t
12.1 Stationary and Nonstationary Variables FIGURE 12.1 U.S. economic time series
12.1 Stationary and Nonstationary Variables FIGURE 12.1 (Continued) U.S. economic time series
12.1 Stationary and Nonstationary Variables • Formally, a time series yt is stationary if its mean and variance are constant over time, and if the covariance between two values from the series depends only on the length of time separating the two values, and not on the actual times at which the variables are observed
12.1 Stationary and Nonstationary Variables • That is, the time series yt is stationary if for all values, and every time period, it is true that: Eq. 12.1a Eq. 12.1b Eq. 12.1c
12.1 Stationary and Nonstationary Variables Table 12.1 Sample Means of Time Series Shown in Figure 12.1
12.1 Stationary and Nonstationary Variables • Nonstationary series with nonconstant means are often described as not having the property of mean reversion • Stationary series have the property of mean reversion
12.1 Stationary and Nonstationary Variables • The econometric model generating a time-series variable yt is called a stochastic or random process • A sample of observed ytvalues is called a particular realization of the stochastic process • It is one of many possible paths that the stochastic process could have taken 12.1.1 The First-Order Autoregressive Model
12.1 Stationary and Nonstationary Variables • The autoregressive model of order one, the AR(1) model, is a useful univariate time series model for explaining the difference between stationary and nonstationary series: • The errors vt are independent, with zero mean and constant variance , and may be normally distributed • The errors are sometimes known as ‘‘shocks’’ or ‘‘innovations’’ 12.1.1 The First-Order Autoregressive Model Eq. 12.2a
12.1 Stationary and Nonstationary Variables FIGURE 12.2 Time-series models 12.1.1 The First-Order Autoregressive Model
12.1 Stationary and Nonstationary Variables FIGURE 12.2 (Continued) Time-series models 12.1.1 The First-Order Autoregressive Model
12.1 Stationary and Nonstationary Variables • The value ‘‘zero’’ is the constant mean of the series, and it can be determined by doing some algebra known as recursive substitution • Consider the value of y at time t = 1, then its value at time t = 2 and so on • These values are: 12.1.1 The First-Order Autoregressive Model
12.1 Stationary and Nonstationary Variables • The mean of yt is: • Real-world data rarely have a zero mean • We can introduce a nonzero mean μ as: • Or 12.1.1 The First-Order Autoregressive Model Eq. 12.2b
12.1 Stationary and Nonstationary Variables • With α = 1 and ρ = 0.7: 12.1.1 The First-Order Autoregressive Model
12.1 Stationary and Nonstationary Variables • An extension to Eq. 12.2a is to consider an AR(1) model fluctuating around a linear trend: (μ + δt) • Let the ‘‘de-trended’’ series (yt -μ - δt) behave like an autoregressive model: Or: 12.1.1 The First-Order Autoregressive Model Eq. 12.2c
12.1 Stationary and Nonstationary Variables • Consider the special case of ρ = 1: • This model is known as the random walk model • These time series are called random walks because they appear to wander slowly upward or downward with no real pattern • the values of sample means calculated from subsamples of observations will be dependent on the sample period • This is a characteristic of nonstationary series 12.1.2 Random Walk Models Eq. 12.3a
12.1 Stationary and Nonstationary Variables • We can understand the ‘‘wandering’’ by recursive substitution: 12.1.2 Random Walk Models
12.1 Stationary and Nonstationary Variables • The term is often called the stochastic trend • This term arises because a stochastic component vt is added for each time t, and because it causes the time series to trend in unpredictable directions 12.1.2 Random Walk Models
12.1 Stationary and Nonstationary Variables • Recognizing that the vt are independent, taking the expectation and the variance of yt yields, for a fixed initial value y0: • The random walk has a mean equal to its initial value and a variance that increases over time, eventually becoming infinite 12.1.2 Random Walk Models
12.1 Stationary and Nonstationary Variables • Another nonstationary model is obtained by adding a constant term: • This model is known as the random walk with drift 12.1.2 Random Walk Models Eq. 12.3b
12.1 Stationary and Nonstationary Variables • A better understanding is obtained by applying recursive substitution: 12.1.2 Random Walk Models
12.1 Stationary and Nonstationary Variables • The term tα a deterministic trend component • It is called a deterministic trend because a fixed value α is added for each time t • The variable y wanders up and down as well as increases by a fixed amount at each time t 12.1.2 Random Walk Models
12.1 Stationary and Nonstationary Variables • The mean and variance of yt are: 12.1.2 Random Walk Models
12.1 Stationary and Nonstationary Variables • We can extend the random walk model even further by adding a time trend: 12.1.2 Random Walk Models Eq. 12.3c
12.1 Stationary and Nonstationary Variables • The addition of a time-trend variable t strengthens the trend behavior: where we used: 12.1.2 Random Walk Models
12.2 Spurious Regressions
12.2 Spurious Regressions • The main reason why it is important to know whether a time series is stationary or nonstationary before one embarks on a regression analysis is that there is a danger of obtaining apparently significant regression results from unrelated data when nonstationary series are used in regression analysis • Such regressions are said to be spurious
12.2 Spurious Regressions • Consider two independent random walks: • These series were generated independently and, in truth, have no relation to one another • Yet when plotted we see a positive relationship between them
12.2 Spurious Regressions FIGURE 12.3 Time series and scatter plot of two random walk variables
12.2 Spurious Regressions FIGURE 12.3 (Continued) Time series and scatter plot of two random walk variables
12.2 Spurious Regressions • A simple regression of series one (rw1) on series two (rw2) yields: • These results are completely meaningless, or spurious • The apparent significance of the relationship is false
12.2 Spurious Regressions • When nonstationary time series are used in a regression model, the results may spuriously indicate a significant relationship when there is none • In these cases the least squares estimator and least squares predictor do not have their usual properties, and t-statistics are not reliable • Since many macroeconomic time series are nonstationary, it is particularly important to take care when estimating regressions with macroeconomic variables
12.3 Unit Root Tests for Stationarity
12.3 Unit Root Tests for Stationarity • There are many tests for determining whether a series is stationary or nonstationary • The most popular is the Dickey–Fuller test
12.3 Unit Root Tests for Stationarity • The AR(1) process yt= ρyt-1 + vt is stationary when |ρ| < 1 • But, when ρ = 1, it becomes the nonstationary random walk process • We want to test whether ρ is equal to one or significantly less than one • Tests for this purpose are known as unit root tests for stationarity 12.3.1 Dickey-Fuller Test 1 (No constant and No Trend)
12.3 Unit Root Tests for Stationarity • Consider again the AR(1) model: • We can test for nonstationarity by testing the null hypothesis that ρ = 1 against the alternative that |ρ| < 1 • Or simply ρ < 1 12.3.1 Dickey-Fuller Test 1 (No constant and No Trend) Eq. 12.4
12.3 Unit Root Tests for Stationarity • A more convenient form is: • The hypotheses are: 12.3.1 Dickey-Fuller Test 1 (No constant and No Trend) Eq. 12.5a
12.3 Unit Root Tests for Stationarity • The second Dickey–Fuller test includes a constant term in the test equation: • The null and alternative hypotheses are the same as before 12.3.2 Dickey-Fuller Test 2 (With Constant but No Trend) Eq. 12.5b
12.3 Unit Root Tests for Stationarity • The third Dickey–Fuller test includes a constant and a trend in the test equation: • The null and alternative hypotheses are H0: γ = 0 and H1:γ < 0 (same as before) 12.3.3 Dickey-Fuller Test 3 (With Constant and With Trend) Eq. 12.5c
12.3 Unit Root Tests for Stationarity • To test the hypothesis in all three cases, we simply estimate the test equation by least squares and examine the t-statistic for the hypothesis that γ = 0 • Unfortunately this t-statistic no longer has the t-distribution • Instead, we use the statistic often called a τ (tau) statistic 12.3.4 The Dickey-Fuller Critical Values
12.3 Unit Root Tests for Stationarity Table 12.2 Critical Values for the Dickey–Fuller Test 12.3.4 The Dickey-Fuller Critical Values
12.3 Unit Root Tests for Stationarity • To carry out a one-tail test of significance, if τc is the critical value obtained from Table 12.2, we reject the null hypothesis of nonstationarity if τ ≤ τc • If τ > τc then we do not reject the null hypothesis that the series is nonstationary 12.3.4 The Dickey-Fuller Critical Values
12.3 Unit Root Tests for Stationarity • An important extension of the Dickey–Fuller test allows for the possibility that the error term is autocorrelated • Consider the model: where 12.3.4 The Dickey-Fuller Critical Values Eq. 12.6
12.3 Unit Root Tests for Stationarity • The unit root tests based on Eq. 12.6 and its variants (intercept excluded or trend included) are referred to as augmented Dickey–Fuller tests • When γ = 0, in addition to saying that the series is nonstationary, we also say the series has a unit root • In practice, we always use the augmented Dickey–Fuller test 12.3.4 The Dickey-Fuller Critical Values
12.3 Unit Root Tests for Stationarity Table 12.3 AR processes and the Dickey-Fuller Tests 12.3.5 The Dickey-Fuller Testing Procedures
12.3 Unit Root Tests for Stationarity • The Dickey-Fuller testing procedure: • First plot the time series of the variable and select a suitable Dickey-Fuller test based on a visual inspection of the plot • If the series appears to be wandering or fluctuating around a sample average of zero, use test equation (12.5a) • If the series appears to be wandering or fluctuating around a sample average which is nonzero, use test equation (12.5b) • If the series appears to be wandering or fluctuating around a linear trend, use test equation (12.5c) 12.3.5 The Dickey-Fuller Testing Procedures