Download
1 / 46
470 likes | 722 Views
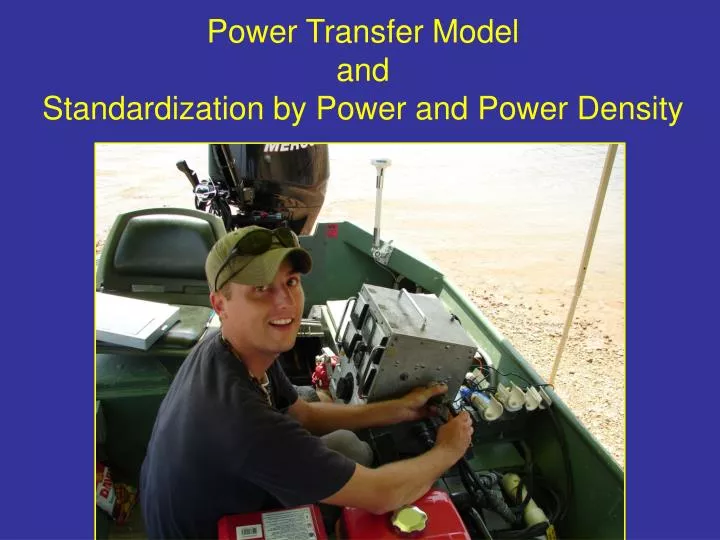
Power Transfer Model and Standardization by Power and Power Density. Session Purposes. To provide participants the principles and framework of the Power Transfer Model of Electrofishing

E N D
Power Transfer Model and Standardization by Power and Power Density
Session Purposes • To provide participants the principles and framework of the Power Transfer Model of Electrofishing • To enable participants to standardize by power, or voltage, or current (primarily) and by power density (secondarily) • -Standardizing by power, voltage, or current requires monitoring control box output to electrodes • -Standardizing by power density requires information about your gear’s electric field and fish capture- prone response thresholds
Session Objectives • Describe the Power Transfer Model of Electrofishing • Describe field procedures for standardizing by power and power density • Develop applied power, voltage, and amperage goal charts for standardizing by power • Develop an applied voltage goal chart for standardizing by power density • Describe lab procedures for determining effective fish conductivity and electrical waveform effectiveness
Power Transfer Model The model assumes that a fixed threshold* of power density must be transferred to a fish to cause a given response (as taxis or immobilization). The power density needed in the water, to achieve the threshold transfer to the fish, is determined by the conductivity mismatch of the fish and water. The model is based of the principle of maximum power transfer in circuits, which states that transfer of energy to a load is most efficient when the load and circuit conductance (resistance) are equal. *A threshold is the minimum amount of a stimulus (electrical power in our case) needed to cause a physical reaction.
Power transfer curve; when the resistances (or conductances) of two loads in a circuit are the same, maximum power is transferred from one load to the other Power Transferred to Load (Watts)
Medium 2 (fish) Medium 1 (water) Applied power Transferred power Diverted power Note that: Applied Power = Diverted Power + Transferred Power
Distortion of electric fields by fish • Three conditions: • water conductivity less than fish (low Cw) • water and fish conductivities equal (med Cw) • water conductivity greater than fish (high Cw) • Cw = water conductivity • CF = fish conductivity = voltage surfaces = current pathways
Power Transfer Model • Assume a hypothetical fish with an effective conductivity (σf) of 100 µS/cm. The response threshold (Dm) is 10 µW/cm3 to achieve a defined response (we’ll say immobilization).
To standardize electrofishing by power in waters of different conductivity, there must be constant power transferred to fish. This requires the Power Transfer Model and adjustment of applied power density based on fish and water conductivity. From Lab Results on Goldfish (Carassiusauratus)
Power Correction Factor • Curve for predicting the increase in power necessary to maintain a constant transfer of power
Power Correction Factor • The PCF equation is: PCF = (1 + q)2 ÷ 4(q) where, q = mismatch ratio = σf ÷ σw
Power Standardization Tables • You can build power goal standardization tables by multiplying threshold power (Dm) by the PCF for the new sample site water conductivity
Power Transfer Model How was this concept verified? • By experimentation (e.g., Kolzand Reynolds 1989, Miranda and Dolan 2003) • By field work (e.g., Burkhardtand Gutreuter 1995, Chick et al. 1999, Miranda 2005, unpublished data)
By Experimentation: A Power Threshold Methodfor Estimating Fish Conductivity Kolz, A.L. & J.B. Reynolds. 1989. Determination of Power Threshold Response Curves. Pages 15 – 24, In Electrofishing, A Power Related Phenomenon. U.S. Department of the Interior, Fish & Wildlife Service, Fish & Wildlife Technical Report 22.
Purpose of Experiment • Demonstrate power threshold method • Estimate “effective” conductivity of goldfish • Compare results with other reported values • Estimate and compare power threshold values among different capture-prone responses and waveforms
Conceptual experimental electrical set-up • Two resistors (loads) in a circuit wherein one resistor is constant and the other varies
Experimental Set-up Water-filled Plastic trough Electrodes
Another Set-up Electrodes in test tank Oscilloscope for voltage Power source: Backpack shocker Multi-meter for current
Power density chart • Used as template to chart fish response data WATER CONDUCTIVITY,μmhos/cm
Conclusions • Fish response related to power density magnitude • Power density curves conform to power transfer model • Power thresholds varied among waveforms • Fish conductivity estimates much lower than values in literature (therefore, “effective fish conductivity”)
Video Example • See the short video on a trial within an experiment for determining power density and voltage gradient thresholds: Fish Immobilization Threshold Experiment
Experimental Protocol Example See Northern Chub Experimental Protocols.docx for an example of an experiment to estimate fish conductivity, most effective waveform types, and power density thresholds for standardized sampling.
Experimental Data Sheet See Electric Waveform Fish Conductivity Analysis Methods.xlsx For an example of experimental data management. This file also will graph threshold results and generate estimates of effective fish conductivity.
By the Field: • Burkhardt and Gutreuter (1995) gained about 15% precision by standardizing waveform type, electrode configuration, and power output in the Upper Mississippi River Long-term Monitoring Program • Detemined threshold power at match and then used power correction factor to derive power goal tables • Colorado example • Fisheries biologists in Colorado sampled a range of water conductivity and estimated threshold amperage settings for successful electrofishing at each site. They used different control boxes.
The Value of the Power Transfer Model for Standardization • The main take-home point of these results is that, under the Colorado stream conditions, the power transfer model can be used to “set the dial” at a given water conductivity. The relationship is not perfect, however, and thus the power transfer model should be used as a baseline to begin fine-tuning adjustments. • Example: You are sampling a stream with a water conductivity of 423 µS/cm and are following the prediction equation: y = 0.0189x + 0.5375 What peak current should you apply as a starting point? Peak Current (A) = 0.0189(423) + 0.5375 = 8.5 peak amps NOTE: this prediction equation was derived under a particular range of stream conditions, species, and capture-prone responses.
Standardization Approaches • The data from Colorado support the power transfer model. • You should derive you own amperage (or voltage or power) standardization table either empirically (as done here with prediction equations) or by using the power transfer model (see EF Goal Power.xlsx). More details upcoming.
Standardizing by PowerField Methods • You must first get “seed” data to derive a power (or volt or amp) goal table • Sample a site, and use the minimum output settings needed for “successful” electrofishing • Due to different electrode designs (and different % power to anodes), particularly in boats, a given power goal table may be applicable only to the boat used to collect the seed data to generate that goal table. • Open Field forms for standardization.pdf and Field Form for Standardization short form.pdf, these forms will explain protocols in detail
Standardizing by PowerAnalysis • Data can be input to EF Goal Power.xlsx, or • Data can be input to the “Power Goals” tab in Electrofishing with Power • Work through the examples under the Power Goal Tab section of the Electrofishing with Power documentation
Standardizing by PowerAn example power (volts, or amps) goal table for successful electrofishing
Standardizing by PowerAn example power goal graph for successful electrofishing
Standardizing by Power Density • This is a less common approach. The purpose is to adjust voltage at different water conductivities to maintain the same effective field size. The output is a voltage goal table for maintaining constant field extent. This approach should lead to the same catchability as (standardizing by power). • The electric field generated by the gear must be mapped • There are two options: 1) Similar to standardizing by power, find the minimum voltage setting required for successful electrofishing; once obtained, select a voltage gradient or power density of interest in your electric field (arbitrary as 0.2 V/cm or a threshold value from the literature) at the applied voltage that resulted in successful electrofishing; derive a voltage goal table to maintain effective field size across the water conductivity range.
Standardizing by Power Density • There are two options (continued): • Use a threshold value from the literature or your lab experiments to set effective field size, as a particular distance from the electrodes (as 100 cm from the center of the boom); this distance may be learned from experience to be a field size that leads to successful electrofishing. a certain percent of a defined area at or above the threshold value (as 95% of the area extending out to 30 cm from the electrode array surface (from Miranda 2005 NAJFM 25:609- 618)
Standardizing by Power Density Once you have determined a desired electric field size and a voltage gradient or power density value that will define the edge of the effective electric field: • Input data into Electric field mapper.xlsx to explore where thresholds occur on your field map • Input data into Electrofishing with Power to derive a voltage goal table for constant field size • Go to the “Voltage Goals, Field Size”, and “Threshold Power Densities” tabs in the Electrofishing with Power • Work through the documentation sections on Voltage Goals, Field Size Tab and Threshold Power Densities tabs
Standardizing by Power Density If you wish to follow the approach of Miranda 2005 NAJFM 25:609-618, wherein desired electric field size is set as a proportion of the measured field near the booms at or above a threshold value, then see EF power density standardization 0.95 worksheet.xlsx This worksheet is a slight modification of a work by Daniel E. Shoup of Oklahoma State University. Many thanks to Dr. Shoup for facilitating this approach to easier application. The overall procedure is presented in Miranda (2005). The main data need is a regression equation relating applied power to some percentile power density value in your gear’s electric field.
Standardize by Procedure and Equipment • Standardize by: • Electrode configuration and placement • Waveform category (AC, DC, PDC [frequency, duty cycle]) • Waveform pulse shape (capacitor discharge, square, etc.); • Power (peak, rms, or average power is fine as long as the metering is accurate) or Power Density; • Procedures in EF Goal Poweror Electrofishing with Power allow you to standardize by power but through using only Voltage or Current. • Sampling design (includes formal designs as well as incorporation of efficiency factors such as turbidity, temperature, etc. [sample only when efficiency factors are above, below, or within a range of values]) • Operations (crew number, experience)
Standardize by Procedure and Equipment • See • Electrofishing Standardization Protocol.pdf for an example of standardization procedures.
Power Standardization in Practice • Power and power density standardization are based upon water conductivity. Water conductivity often is implicated as an important factor affecting catchability. Power standardization assumes that water conductivity is the only significant influence on catchability. • If water conductivity is the only significant efficiency factor, then generating power, voltage, or amperage goal tables from seed data is sufficient to provide a starting point to standardize and reduce variability in catchability. • However, other environmental (e.g., stream size) and population factors (e.g., density) can be as or more important than water conductivity. If this is the case, collecting seed power data and using the derived goal table may not be sufficient unless the non-conductivity factors have the same effect across water conductivity • Given a situation with additional important efficiency factors, adjusting output power to achieve successful electrofishing will be influenced by all these factors together, not just by water conductivity. Thus, instead of just relying on goal tables, the biologist must perform a preliminary test run near each sampling site to fine-tune the settings.
Power Standardization in Practice • Power standardization typically may be more effective for boat shocking in lakes or larger streams than in small stream backpack electrofishing, due to the nature of the equipment and the environments (small streams may be more variable). • Power standardization can help eliminate water conductivity as a covariate or factor in catchability, improving capture efficiency equations. • An operator can use seed data to get the theoretical applied power goal curve/table and use the information as a baseline. The power goals can help fine tune settings that are derived on a site-by-site basis by trial runs. • Site-by-site settings that do not follow the theoretical applied power goal table may be an indication that other important efficiency factors are influencing catchability.
Power Standardization in Practice • Performing a power analysis on your equipment in context of minimum power needed for successful electrofishing is important. • Often, biologists “take what they can get”, and accept sub-optimal outputs • For example, if the power demands are higher than the capacity of a particular control box, the box may throw breakers or blow fuses. If you turn down your output so that your unit can function, you may not be doing yourself a favor; in fact, you may be accepting very low catch rates that may not be helpful for management decisions.
Next Step “Electrofishing Efficiency and Samplling” (Module 6)