Download
1 / 36
360 likes | 514 Views
The “Afternoon” constellation of satellites make near simultaneous measurements to better understand important parameters related to climate change. The satellites greatly complement each other, making measurements of aerosols, clouds, temperature, relative humidity, and radiative fluxes.

E N D
The “Afternoon” constellation of satellites make near simultaneous measurements to better understand important parameters related to climate change. The satellites greatly complement each other, making measurements of aerosols, clouds, temperature, relative humidity, and radiative fluxes. Daily global coverage is achieved in 14.55 orbits per day,@ 24.7 degree separation. Orbits match the World Reference System 2 (WRS-2) reference grid (Developed for LANDSAT).
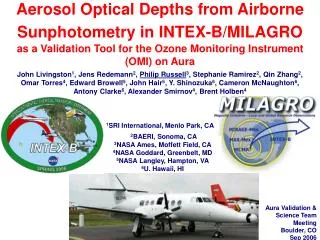
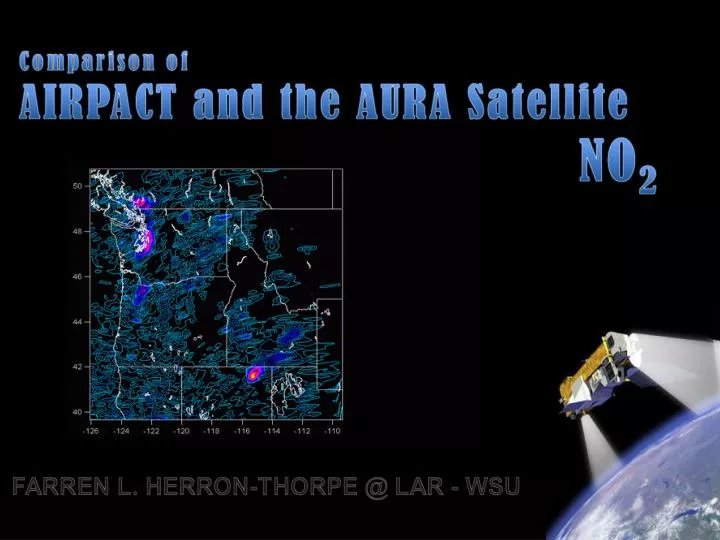
“Ozone Monitoring Instrument” - continues the TOMS record • Measures total ozone, as well as other ozone-related chemistry. • Capable of mapping pollution products on urban to super-regional scales. • Contributed to the EOS Aura mission by the Netherlands's Agency for Aerospace Programs in collaboration with the Finnish Meteorological Institute. • Uses hyperspectral imaging in a “push-broom” mode to observe solar backscatter radiation in the visible and ultraviolet, using a wide-field telescope feeding two imaging grating spectrometers with CCD. • Tropospheric NO2 columns are derived from satellite observations based on slant column NO2 retrievals with the DOAS technique, and the KNMI combined modelling/retrieval/assimilation approach.
OMI Data: Dutch vs American • DUTCH Algorithm • Array Format -HDF • Negative Values • Missing Data Points • Data Available From: May 18, 2006 • AMERICAN Algorithm • Matrix Format - HDF-EOS • No Negative Values • All Data Points Given • Data Available From: Sept. 28, 2004
AIRPACT Model vs OMI DataSome of the Challenges Involved When Comparing the Different Data Types • AIRPACT Model • 17 Layers Predicted • 9025 Data Points per Layer over Region • Mixing Ratio Given • Fire Impact Included • Appropriate Layer Must be Chosen (Max Value) • One Data Set per Hour • Equal Pixel Sizes (12x12 km2) • Full Region Available • OMI Data • One Tropo. Value (VCD) • Approximately 5000 Data Points over Region • VCD Conversion (mol/cm2) to PPBV Requires PBL Depth Assumption • One Data Set per Day (Overhead @ 21:00 UTC) • Varying Pixel Sizes (12x13 km2 at center of swath) • Desired Region at Edges?
Varying Time Periods Selected and Data Obtained for OMI (American & Dutch) and AIRPACT (Early September Displayed) • OMI Vertical Column Depth Troposphere Values Converted to PPBV Using Assumed PBL Height • Max Concentration Value (1 of 17 Layers) from AIRPACT (closest hour) Used for Comparison • OMI (HDF) and AIRPACT Data Converted to Lat/Long Columnar Format • Data Sets Interpolated onto Standard Coordinate Grid Using IGOR Pro • Bias, Ratio, and Stats Analysis Performed on a Per Point Per Day Basis
NO2 in Troposphere – Sept. 3, 2006 OMI (American) OMI (Dutch) Amer. Sub Dutch BIAS
NO2 in Troposphere – Sept. 4, 2006 OMI (American) OMI (Dutch) Amer. Sub Dutch BIAS
NO2 in Troposphere – Sept. 5, 2006 OMI (American) OMI (Dutch) Amer. Sub Dutch BIAS
NO2 in Troposphere – Sept. 6, 2006 OMI (American) OMI (Dutch) Amer. Sub Dutch BIAS
NO2 in Troposphere – Sept. 7, 2006 OMI (American) OMI (Dutch) Amer. Sub Dutch BIAS
NO2 in Troposphere – Sept. 8, 2006 OMI (American) OMI (Dutch) Amer. Sub Dutch BIAS
NO2 in Troposphere – Sept. 3, 2006 OMI (American) AIRPACT Amer. Sub AIRPACT BIAS
NO2 in Troposphere – Sept. 4, 2006 OMI (American) AIRPACT Amer. Sub AIRPACT BIAS
NO2 in Troposphere – Sept. 5, 2006 OMI (American) AIRPACT Amer. Sub AIRPACT BIAS
NO2 in Troposphere – Sept. 6, 2006 OMI (American) AIRPACT Amer. Sub AIRPACT BIAS
NO2 in Troposphere – Sept. 7, 2006 OMI (American) AIRPACT Amer. Sub AIRPACT BIAS
NO2 in Troposphere – Sept. 8, 2006 OMI (American) AIRPACT Amer. Sub AIRPACT BIAS
Seattle/Portland NO2– Sept. 3, 2006Urban Region – (1000 meter Vertical Column Assumed) Cloud Cover Fraction OMI (American) OMI (Dutch) AIRPACT
Seattle/Portland NO2– Sept. 4, 2006Urban Region – (500 meter Vertical Column Assumed) Cloud Cover Fraction OMI (American) OMI (Dutch) AIRPACT
Seattle/Portland NO2– Sept. 5, 2006Urban Region – (500 meter Vertical Column Assumed) Cloud Cover Fraction OMI (American) OMI (Dutch) AIRPACT
Seattle/Portland NO2– Sept. 6, 2006Urban Region – (500 meter Vertical Column Assumed) Cloud Cover Fraction OMI (American) OMI (Dutch) AIRPACT
Seattle/Portland NO2– Sept. 7, 2006Urban Region – (500 meter Vertical Column Assumed) CloudCoverFraction OMI (American) OMI (Dutch) AIRPACT
Seattle/Portland NO2– Sept. 8, 2006Urban Region – (500 meter Vertical Column Assumed) Cloud Cover Fraction OMI (American) OMI (Dutch) AIRPACT
Urban vs. Entire AIRPACT Domain Bias Results Large Number of Zero Values Agree in Entire Domain. Vertical Height Assumption has Strong Influence Consistent Bias Between OMI & AIRPACT evident in Urban area but not in entire domain (Fires).
Meteorological Influence: Cloud Cover and Temperature were analyzed to determine if meteorology directly correlates to differences between AIRPACT and OMI Amer. sub AIRPACT CFRAC Cloud cover and temperature not related to differences between OMI and AIRPACT (Sept. 3rd bias vs CFRAC shown. Temperature & CFRAC of other days show similar results)
Conclusions: American OMI Data Results: -Close Agreement to Airpact when Reasonable PBL Height Assumed -No Negative Values (Some Dutch Contour “lost” to negatives) -More Troposphere Data Available (No “lost” points; Entire AURA life) Dutch OMI Data Results: -Shows higher values in Fire Regions (as predicted) AIRPACT Results: -Often Predicts an Order of Magnitude Higher for NO2 from Fires -Accurately Predicts Urban Concentrations of NO2 -Doesn’t capture rural NO2 reported by OMI algorithms (farms?) Meteorological Factors: -Seem to have no direct correlation to the difference in results.
Possible Reasons for Major Differences: -Accurate Vertical Height (PBL?) Needed (Majority of NO2 probably resides at the bottom of the troposphere in urban areas) -AIRPACT may be over-estimating NO2 concentrations in Fire Regions -OMI may not be detecting fires in small canyon areas
Future Endeavors: • Compare other chemical species predicted by AIRPACT to satellite observations (much of the troposphere data has not been released yet) • Compare results to actual field measurements • Use Variable PBL Depths as Predicted by AIRPACT per point • Use a weighted layer average rather than a max layer value for AIRPACT.
Thanks to: • Brian Lamb • George Mount • Joseph Vaughan • Everyone else at LAR – WSU • NASA & NAAP (Netherlands's Agency for Aerospace Programs)
References: http://aura.gsfc.nasa.gov/instruments/ http://www.nasa.gov http://www.temis.nl/airpollution/no2.html http://www.temis.nl/docs/AD_NO2.pdf http://www.temis.nl/products/no2.html http://www-calipso.larc.nasa.gov/about/atrain.php Data Access: http://www.temis.nl/airpollution/no2col/omi_data.php?year=2006 http://disc.sci.gsfc.nasa.gov/data/datapool/OMI/ sftp://zephyr.cmer.wsu.edu