Download
1 / 22
230 likes | 321 Views
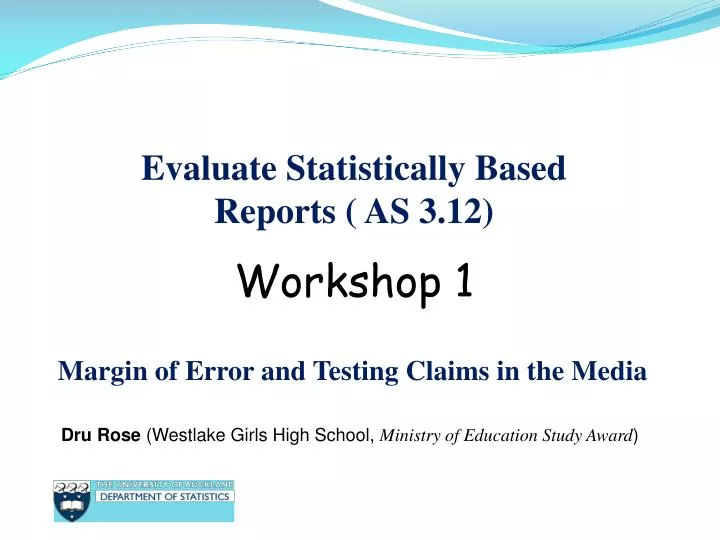
Evaluate Statistically Based Reports ( AS 3.12). Workshop 1. Margin of Error and Testing Claims in the Media. Dru Rose (Westlake Girls High School, Ministry of Education Study Award ). What does AS 3.12 cover?. Polls and Surveys Non-sampling errors and survey concerns (Workshop 2)

E N D
Evaluate Statistically Based Reports ( AS 3.12) Workshop 1 Margin of Error and Testing Claims in the Media Dru Rose (Westlake Girls High School, Ministry of Education Study Award)
What does AS 3.12 cover? • Polls and Surveys • Non-sampling errors and survey concerns(Workshop 2) • Sampling error :Workshop 1 margin of error, 95% confidence intervals for proportions, “rules of thumb”, testing claims • Experimental and Observational Studies (Workshop 2) Dru Rose
The purpose of this workshop • To demonstrate the power of technology for developing the concept of margin of error (making the topic accessible to a wider diversity of students than a theoretical approach relying on the central limit theorem and the normal distribution). • To give you a snap-shot of the teaching approach I developed and trialled with a small group of students. Dru Rose
Resource Pack Contents (available from www.censusatschool.org.nzafter today) • The 6 to 7 lesson teaching sequence for sampling error, with teaching notes • Power-point slides (sampling error , political polls) • 6 media reports • Students worksheets and resource materials linked to the teaching sequence • 3 csv data files to import into iNZight Dru Rose
Margin of error • Media Reports have a dual role: • They provide a purpose for developing the concepts • They provide a real life-context with • claims to be tested after developing the • concepts Dru Rose
3 types of claim and rules of thumb: • Single poll % 51% of young people agree there is too much sex, violence and bad language on TV MoE ≈ • Comparison within one group Young people are more likely to agree than disagree MoE for the difference ≈ 2 x MoE • Comparison between independent groups Young women are more likely to agree than young men MoE for the difference ≈ 1.5 x Average MoE Dru Rose
Conceptualising a Margin of Error • Margin of error involves the sampling variability of a proportion (%) –a categorical parameter • Before using a computer simulation, do a concrete activity which mimics what will later be seen in the software Dru Rose
3 types of claim and rules of thumb: • Single poll % 51% of young people agree there is too much sex, violence and bad language on TV MoE ≈ • Comparison within one group Young people are more likely to agree than disagree MoE for the difference ≈ 2 x MoE • Comparison between independent groups Young women are more likely to agree than young men MoE for the difference ≈ 1.5 x Average MoE Dru Rose
I wonder what percentage of all 600 KareKare College students travel to school by car? (“motor” on the cards) Population 600 students Sample n = 25 Dru Rose
For small sample sizes (n=30), sample proportions (categorical data) are much more variable than sample means or medians (quantitative data) See Wild’s animations Dru Rose
Looking at the world using data is Like looking through a window with ripples in the glass “What I see … is not quite the way it really is”
Although imperfect, each sample should give a reasonable picture of the population as a whole. • In the real world, we usually only have one sample. We want to use this sample to estimate the population parameter. (make an inference) e.g. estimate the percentage of students at KareKare College who travel to school by car. • Since the sample is representativeof the population, we willre-samplefrom the sample (with replacement)to estimate the sample-to-sample variability iesampling error or margin of error. • Re-sampling from the sample is called Bootstrapping
n=100 CI half as long MoE ≈ 10%
Repeat coverage module with n=100 n × 4 halves length of CI , MoE =10% • Repeat bootstrap module with n=500 from whole census at school database CI length = 9%, MoE = 4.5% =0.2=20%, =0.1=10%, =0.045=4.5%, Rule of thumb to estimate MoE =
“Opinion Divided on NZ-US exercises” = = 3.7% Margin of error % who support resumption 95% CI: Meaning: Judgement: = 47.6% 47.6% With 95% confidence, we can infer that the % of Nzers who support the resumption of exercises is somewhere between 43.9% and 51.3% 43.9% 51.3% Claim of 50% support for resumption of excercises NOT supported since support could be as low as 43.9%.
Broadcasting Standards Poll Can it be claimed that: “More young people agree than disagree that there is too much sex, violence and bad language on TV” ? Dru Rose
Difference in Poll %s Consider this scenario: MoE = 4% sample % who agree could be somewhere between 46% and 54% A likely new sample Difference in new sample poll %s = 8perct. pts = 2 × MoE • A difference of more than 2 × MoEwould be needed to disprove a claim of 50% agree 50% 50% 54% 46% Dru Rose
Broadcasting Standards Poll (1) Can it be claimed that more young people agree than disagree? = 4.1% Sample Size n = 600 Poll MoE 2 x 4.1 = 8.2 perc. pts Difference 51-44 = 7 perc. pts MoE difference 7 15.2 -1.2 95% CI difference [ -1.2 perc pts. , 15.2 perc. pts.] More young people may disagree than agree by up to 1.2 perc.ptsand more young people may agree than disagree by up to 15.2 perc. pts Meaning Dru Rose Claim Not Supported Judgement
MoE for difference = 8.6% (half CI) = =6.5% MoE Males =6.1% MoEFemales Average MoE= () = 6.3% Rule of thumb for MoE difference = 1.5 x Av MoE= 1.5 x 6.3 =9% We can show that this works about 95% of the time Dru Rose
Broadcasting Standards Poll (2) Can it be claimed that young women were more likely to agree than young men ? = =5.8% = =5.7% MoEmen MoEwomen = () = 5.75% MoE difference Av MoE 1.5 x 5.75 = 8.6% 12 =57-45 = 12 perc. pts Difference 3.4 20.6 95% CI difference [3.4 perc pts. , 20.6 perc. pts.] The % of Young women who agreed was somewhere between 3.4 and 20.6 perc. pts more than the % of young men meaning Dru Rose Judgement Claim is supported
Why teach AS3.12 ? • Statistical Literacy is an essential life-skill to function effectively in the information age (Wallman, 1993; Gal, 2002) • Broadens students’ horizons, taking statistical understanding beyond the classroom into the real world (a motivational aspect for students in the trial) • Accessible to less academic students • External standard • Only pre-requisite is AS2.9 (possibly just 1.10) • Links to other standards students may be taking(formal inference AS3.10, experiments AS3.11, bi-variate data AS 3.9) Dru Rose