Download
1 / 24
240 likes | 428 Views
A genetic interaction map of drug responses in cancer cell lines Felix Klein (Huber group). Marco Breinig. Synthetic genetic interactions. Gene A. Gene A. Gene A. Gene A. Gene B. Gene B. Gene B. Gene B. viable. viable. viable. lethal. Relevance to cancer. Gene A. Gene A. Gene A.

E N D
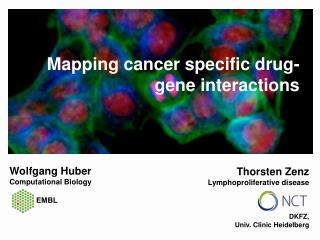
A genetic interaction map of drug responses in cancer cell linesFelix Klein (Huber group) Marco Breinig
Synthetic genetic interactions Gene A Gene A Gene A Gene A Gene B Gene B Gene B Gene B viable viable viable lethal
Relevance to cancer Gene A Gene A Gene A Gene B Gene B Gene B (cancer mutation) normal cells normal cells cancer cells viable lethal viable
Relevance to cancer Kornelia Polyak & Judy Garber nature medicine 2011
Correlation of features • 385 extracted features
Feature selection 20 non-redundant features selected signal-to-noise (cor. of residuals) ratio of positive correlations
How to measure synthetic genetic interactions? Luo, J. et al., Cell (2009). Sandmann, T. & Boutros, M. Current Opinion in Genetics & Development (2012)
How to measure synthetic genetic interactions? fit a linear model log(cell number) ~ drug + cell line + drug * cell line moderated t-test on the interaction terms interaction term
Quality control cell number negative controls
Significant interactions cell number FDR < 0.1 FDR < 0.01
Interaction map cell number 1 AKT1-/-&AKT2-/- 2 MEK2-/- 3 AKT1-/- 4 CTNNB1 mt-/wt+ 5 PAR007 6 P53-/- 7 PTEN-/- 8 PI3KCA mt-/wt+ 9 KRAS mt-/wt+ 10 BAX-/- 11 MEK1-/- 12 PAR001 drugs cell lines
Interaction map cell number FDR < 0.01 1 AKT1-/-&AKT2-/- 2 MEK2-/- 3 AKT1-/- 4 CTNNB1 mt-/wt+ 5 PAR007 6 P53-/- 7 PTEN-/- 8 PI3KCA mt-/wt+ 9 KRAS mt-/wt+ 10 BAX-/- 11 MEK1-/- 12 PAR001 drugs cell lines
Interaction map cell eccentricity FDR < 0.1 1 AKT1-/-&AKT2-/- 2 MEK2-/- 3 AKT1-/- 4 CTNNB1 mt-/wt+ 5 PARENTAL007 6 P53 -/+ 7 P53-/- 8 PTEN-/- 9 PI3KCA mt-/wt+ 10 KRAS mt-/wt+ 11 BAX-/- 12 MEK1-/- 13 PARENTAL001 drugs cell lines
Specific interaction of BIX 01294 BIX 01294 CTNNB1 mt-/wt+ negative control (DMSO) CTNNB1 mt-/wt+ BIX 01294 other cell lines AKT1-/- & AKT2 -/- MEK1 -/- Par001 KRAS mt-/wt+
Clustering of interaction profiles: Guilt by association Cluster 1: microtubule function inhibitors Cluster 2: Topoisomerase II DNA Metabolism CDK2 Cluster 3: STAT3 inhibitor Ikb-alpha inhibitor Cluster 4: PP2A and other phosphatases drugs drugs
Improvement of clustering Distribution of correlation values for compound, factored by annotated selectivity
Current follow ups Drug synergy (cell viability assay) MEK and PI3K inhibitors with Disulfiram PD98059 (MEK2), U0126 (MEK1/2), wortmannin (PI3K) AKT inhibitors with Bendamustine MK2206 (Akt 2(1/3), AktVIII (Akt1/2/3)
Current follow ups Mode of action STAT3 and IkB-alpha inhibitors show similar interaction profiles STAT3 and NF-kb reporter assay Drug treatment Pathway activation at day 4
Summary & Conclusions we established a method to detect synthetic genetic interactions using isogenic cell lines we are able to detect specific interactions similar drug interaction profiles can be linked to similar biological processes
Acknowledgements Wolfgang Huber Simon Anders Joseph Barry Bernd Fischer Julian Gehring Aleksandra Pekowska Paul Theodor Pyl Alejandro Reyes Maria Secrier Tibor Pakozdi Andrzej Oles Malgorzata Oles Collaborators at DKFZ: Michael Boutros Marco Breinig