Download
1 / 60
950 likes | 2.27k Views
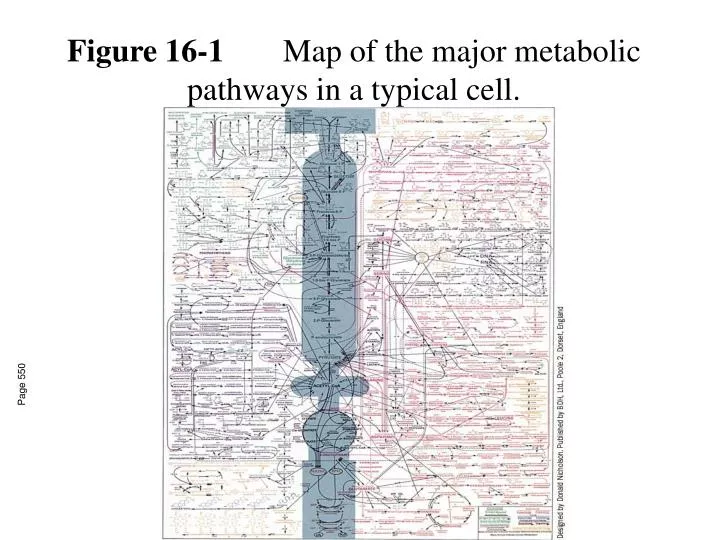
Figure 16-1 Map of the major metabolic pathways in a typical cell. Page 550. Figure 16-3 Overview of catabolism. Page 551. Figure 16-6a Types of metabolic group-transfer reactions. ( a ) Acyl group transfer. Page 554.

E N D
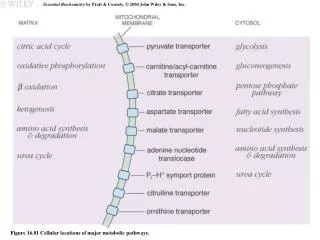
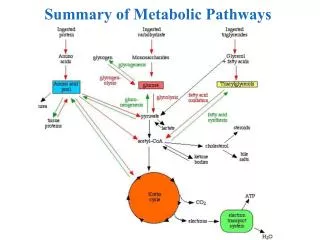
Figure 16-1 Map of the major metabolic pathways in a typical cell. Page 550
Figure 16-3Overview of catabolism. Page 551
Figure 16-6a Types of metabolic group-transfer reactions. (a) Acyl group transfer. Page 554
Figure 16-6b Types of metabolic group-transfer reactions. (b) Phosphoryl group transfer. Page 554
Figure 16-6cTypes of metabolic group-transfer reactions. (c) Glycosyl group transfer. Page 554
Table 16-2b Some Trace Isotopes of Biochemical Importance. Page 563
Figure 16-15 The expression of creatine kinase in transgenic mouse liver as demonstrated by localized in vivo 31P NMR. Page 561
Figure 16-17 The metabolic origin of the nitrogen atoms in heme. Page 564
Figure 16-19 The flow of a pulse of radioactivity from precursor to product. Page 565
Table 16-3 Standard Free Energies of Phosphate Hydrolysis of Some Compounds of Biological Interest. Page 566
Figure 16-20 The structure of ATP indicating its relationship to ADP, AMP, and adenosine. Page 566
Figure 16-22 Resonance and electrostatic stabilization in a phosphoanhydride and its hydrolysis products. Page 568 (previously on p. 3)
Figure 16-21a Some overall coupled reactions involving ATP. (a) The phosphorylation of glucose to form glucose-6-phosphate and ADP. Page 567
Figure 16-21b Some overall coupled reactions involving ATP. (b) The phosphorylation of ADP by phosphoenolpyruvate to form ATP and pyruvate. Page 567
Figure 16-25 The flow of phosphoryl groups from “high-energy” phosphate donors, via the ATP–ADP system, to “low-energy” phosphate acceptors. Page 569
Figure 16-29b Two examples of open systems in a steady state. (b) The steady state of the biosphere is similarly maintained by the sun. Page 576
Table 16-4b Standard Reduction Potentials of Some Biochemically Important Half-reactions Page 573
Figure 16-8 The molecular formula and reactions of the coenzyme flavin adenine dinucleotide (FAD). Page 556
Figure 17-1 Glycolysis. Page 582
Figure 17-3 Degradation of glucose via the glycolytic pathway. Page 584
Table 17-1 Standard Free Energy Changes (DG°¢), and Physiological Free Energy Changes (DG) in Heart Muscle, of the Reactions of Glycolysisa. Page 613
Figure 17-4 The nucleophilic attack of the C6—OH group of glucose on the g phosphate of an Mg2+–ATP complex. Page 585
Figure 16-7 The phosphoryl-transfer reaction catalyzed by hexokinase. Page 555
Figure 17-5a Conformation changes in yeast hexokinase on binding glucose. (a) Space-filling model of a subunit of free hexokinase. (b) Space-filling model of a subunit of free hexokinase in complex with glucose (purple). Page 586 Page 586
Figure 17-6 Reaction mechanism of phosphoglucose isomerase. Page 587
Figure 17-7 Base-catalyzed isomerization of glucose, mannose, and fructose. Page 588
Figure 17-8 Mechanism for base-catalyzed aldol cleavage. Page 589
Figure 17-9 Enzymatic mechanism of Class I aldolase. Page 590
Page 557 Figure 16-10 Mechanism of aldose–ketose isomerization.
Figure 17-10 Proposed enzymatic mechanism of the TIM reaction: General Acid Catalysis. Page 593
Figure 17-13a Some reactions employed in elucidating the enzymatic mechanism of GAPDH. (a) The reaction of iodoacetate with an active site Cys residue. (b) Quantitative tritium transfer from substrate to NAD+. Page 596
Figure 17-13c Some reactions employed in elucidating the enzymatic mechanism of GAPDH. (c) The enzyme-catalyzed exchange of 32P from phosphate to acetyl phosphate. Page 596
Figure 17-14 Enzymatic mechanism of glyceraldehyde-3 phosphate dehydrogenase. Page 596
Figure 17-15 Space-filling model of yeast phosphoglycerate kinase showing its deeply clefted bilobal structure. Page 597
Figure 17-17 The active site region of yeast phospho-glycerate mutase (dephospho form) showing the substrate, 3-phosphoglycerate, and some of the side chains that approach it. Page 598
Figure 17-18 Proposed reaction mechanism for phospho-glycerate mutase. Page 599
Figure 17-19 The pathway for the synthesis and degradation of 2,3-BPG in erythrocytes is a detour from the glycolytic pathway. Page 600
Figure 17-20 The oxygen-saturation curves of hemoglobin (red) in normal erythrocytes and those from patients with hexokinase (green) and pyruvate kinase deficiencies (purple). Page 600
Figure 17-21 Proposed reaction mechanism of enolase. Page 601
Figure 17-22 Mechanism of the reaction catalyzed by pyruvate kinase. Page 602
Figure 17-23 The active site region of porcine H4 LDH in complex with S-lac-NAD+, a covalent adduct of lactate and NAD+. Page 603
Figure 17-24 Reaction mechanism of lactate dehydrogenase. Page 603
Figure 17-25 The two reactions of alcoholic fermentation. Page 604
Figure 17-26 Thiamine pyrophosphate. Page 604
Figure 17-27 Reaction mechanism of pyruvate decarboxylase. Page 605