Download
1 / 86
860 likes | 1.01k Views
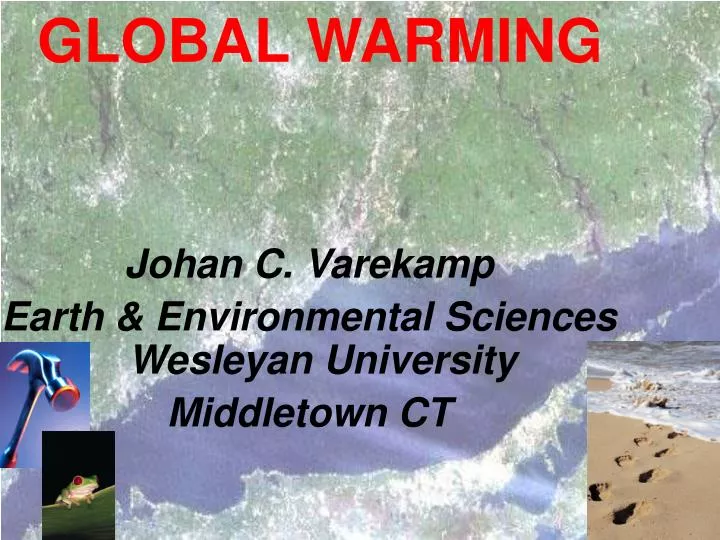
GLOBAL WARMING. Johan C. Varekamp Earth & Environmental Sciences Wesleyan University Middletown CT. Structure of this presentation 1. Global Warming-real or not? 2. Climate science, models and predictions. Source: OSTP. Variations of the Earth’s Surface Temperature*.

E N D
GLOBAL WARMING Johan C. Varekamp Earth & Environmental Sciences Wesleyan University Middletown CT
Structure of this presentation1. Global Warming-real or not?2. Climate science, models and predictions
Variations of the Earth’s Surface Temperature* *relative to 1961-1990 average Source: IPCC TAR 2001
The Exploration of the West: Conditioned by climate change? Vikings (Eric the Red) da Verrazano Columbus Hudson, Block Boston Massacre
Collapse of the Larsen Ice Shelf near Antarctica - a piece of ice the size of Rhode Island came adrift
So these are the data:There is global warming, ice is melting, glaciers are retreating, rainfall patterns are changing, plants and animal species are “moving”, sea level is rising.The real BIG question is:Natural Variability or the “Human Hand”?
THE GREENHOUSE EFFECTTHE SUN EMITS SHORT WAVELENGTH RADIATION (‘VISIBLE LIGHT’) WHICH PENETRATES THROUGH THE ATMOSPHERE AND HEATS THE SOLID EARTH.THE SOLID EARTH EMITS LONG WAVE LENGTH RADIATION (‘INFRA RED’) WHICH IS ABSORBED ‘ON ITS WAY OUT’ BY THE GREENHOUSE GASES.A THERMAL BLANKET IS THE RESULT
Principles of terrestrial climate: Incoming solar radiation equals outgoing terrestrial radiation Rsun = Rterr The magnitude of Rterr depends on Ts (Boltzman Law). Part of the outgoing terrestrial radiation is blocked by greenhouse gases, and the earth warms up a bit to restore the radiative equilibrium
GREENHOUSE GASES:H2O, CO2, CH4, N2O, O3, CFC CHANGES IN THE CONCENTRATIONS OF THE GREENHOUSE GASES OVER TIME?
Burning of fossil fuels Source: OSTP
Deforestation Source: OSTP
ANTHROPOGENIC CARBON FLUXES IN THE 1990s: FOSSIL FUEL BURNING: 6 BILLION TONS CARBON/YEAR DEFORESTATION: 1.1 BILLION TONS CARBON/YEAR TOTAL: 7.1 BILLION TONS CARBON/YEAR WHERE IS ALL THAT CO2 GOING??
Clear correlation between atmospheric CO2 and temperature over last 160,000 years • Current level of CO2 is outside bounds of natural variability • Rate of change of CO2 is also unprecedented Source: OSTP
If nothing is done to slow greenhouse gas emissions. . . • CO2 concentrations will likely be more than 700 ppm by 2100 • Global average temperatures projected to increase between 2.5 - 10.4°F (1.4 - 5.8 oC) 2100 Source: OSTP
MUCH OF THE CO2 EMITTED INTO THE ATMOSPHERE DOES NOT STAY THERE - TAKEN UP BY PLANTS AND DISSOLVES IN THE OCEANSTHE CARBON CYCLE!
Predicted CO2 increase from carbon emission records Missing Carbon
How do we model future atmospheric CO2 concentrations? • Apply a carbon cycle model to a range of future Fossil Fuel Flux scenarios • Use ‘economic scenarios’ that depend strongly on • Population growth rates • Economic growth • Switch to alternative energy technologies • Sharing of technology with the developing world
Carbon cycle model from E&ES 132/359 at Wesleyan University Symbols: Mx = mass of carbon Kx = rate constant FFF = Fossil Fuel Flux of Carbon Feedbacks: Bf = Bioforcing factor; depends on CO2(atm) K4 = f(temperature)
To go from atmospheric CO2 concentration change to climate change, we need to know the climate sensitivity parameter, l. The common approach is: DTs = lDForDF/DTs = 1/l where DF is the ‘radiative forcing’ caused by the increased CO2 concentration. The value of DF can be calculated from the increase in CO2 concentration using an integrated version of deBeers law. DTs is the change in the surface temperature of the earth We can solve for l by taking the first derivative of the ‘greenhouse modified’ Boltzman’s Law F = t sTs4 or dF/dTs = 4F/Ts leading to a l value of 0.3 K/Wm-2. That value equals 0.27 K/Wm-2 for an earth with similar albedo but no atmosphere (no greenhouse). This approach is the most fundamental response function and uses zero climate feedbacks! Climate models use 0.3 - 0.9 K/Wm-2, incorporating various positive and negative feedbacks.
Temperature Projections (TAR) • Global average temperature is projected to increase by 1.5 to 5.8 °C in 21th century • Projected warming larger than in SAR • Projected rate of warming is high compared to the climate record Source: IPCC TAR 2001
If we continue as we have done for the last 100 years (business-as-usual scenario), we will be looking at a much warmer earth, with many unpredictable side effects (sea level, extreme events, changes in carbon cycle -methane in tundras, methane in clathrates, etc)
The Kyoto Protocol • Main aim is to stabilize the concentrations of CO2 and the other GHG in the atmosphere through reductions in carbon emissions • Direct Goal: reduce carbon emissions by ~ 5 % below 1990 emission levels in 1012 • Uses trading of ‘carbon pollution units’ as an incentive for the economically least painful way • Net effect would be that atmospheric CO2 concentrations in 2012 would be about 1-2 ppm below non-treaty levels!
141 countries have ratified the treaty (55% of the carbon emissions), with the big absences in the western world being the USA (20 % of the carbon emissions) and Australia. Large carbon contributors from the emerging economies (but growing fast!) are China, India and Brazil, which are exempt from the protocol.
The Kyoto protocol is not the wisdom of scientists nor the folly of the greens, but shows the courage of progressive politicians to work on the future of our planet - one small step at a time
Could these be related? Greenhouse surprises and unexpected events
Evidence for very rapid climate change in the past: Younger Dryas cold period
The white colours are urban areas: high population density along western LIS
Estuary of National Importance • The Urban Sea – more than 28 million people live within a one-hour drive from its shores • LIS contains over 18 trillion gallons of water • LIS watershed > 16,000 square miles • LIS is 170 km long, 30 km wide, mean depth 20 m • A source of food, recreation, and commerce
Environmental Issues in LISCoastal Salt Marsh DegradationSeasonally Hypoxic Bottom WatersMetal PollutionEcosystem Shifts
Regional Issues Eutrophication, Contamination,Invasive SpeciesGlobal IssuesClimate Change
SEA LEVEL RISE IN LONG ISLAND SOUND OVER THE LAST MILLENNIUM