Download
1 / 73
850 likes | 1.46k Views
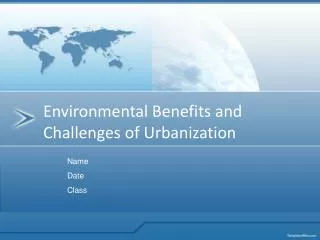
Environmental and Health Impacts of Urbanization. Joyce E. Rosenthal September 16, 2003 Mailman School of Public Health Environmental Health Sciences Division. Today’s Talk. Overview of some major environmental impacts of contemporary urbanization in the U.S.: Water quality Air quality

E N D
Environmental and Health Impacts of Urbanization Joyce E. Rosenthal September 16, 2003 Mailman School of Public Health Environmental Health Sciences Division
Today’s Talk • Overview of some major environmental impacts of contemporary urbanization in the U.S.: • Water quality • Air quality • Urban heat island effect • Biodiversity loss
Major Points • In the US (and increasingly other nations), recent urbanization has become a process of “spreading out” – the vast expansion of metropolitan regions. • The adverse ecological impacts that stem from low-density urbanization are associated with adverse public health impacts • The public health and planning professions are challenged to work together to understand the impact of the built environment on health, and build communities that promote physical and mental health.
Change in Metropolitan Population and Developed Land Area, 1970-1990 Source: H. Diamond, P. Noonan, Land Use in America, Island Press, 1996
Urban Density (persons per hectare) Source: Adapted from Kenworthy, Laube, Newman and Barter 1996
Sprawl, defined: Includes “leapfrog” or scattered development, commercial strips along roadsides, and large expanses of low-density or single-use development that isolates living, working, and shopping places from each other. Sprawl is best defined by it’s impacts or indicators: including poor accessibility between residences and other destinations and a lack of functional open space; and auto-oriented commercial land use at the edge or beyond existing urbanization. Prof. Reid Ewing of Florida Int’l University; and Lee Epstein, Chesapeake Bay Foundation
Changes in residential development styles: large-lot housing
Roots of Sprawl • Housing policies • Highway building vs. transit investment • Zoning policies • Lack of regional planning • Competition for tax revenue • Lifestyle choices
Las Vegas map and total population 1964: 127,000 1972: 273,000 1986: 608,000 1992: 863,000 1997: 1,124,00
Problems with Sprawl • Environmental impacts • Health impacts • Automobile dependency • Land consumption & loss of farmland • Loss of a ”sense of place" • Costs to local government (infrastructure) • Social impacts and disinvestment in city centers
Environmental impacts of low-density land development -- aka Sprawl: • Water pollution: reduction in water quality through creation of impervious surfaces • * Air pollution: On-road vehicles impact on urban health and add greenhouse gases • * Soil erosion • *Habitat loss and fragmentation: loss of local biodiversity • * Loss of farmland • * Inefficient resource use: and depletion of non- renewable resources (e.g. petroleum); increased energy consumption
Urbanization impacts on aquatic resources in four categories: * Hydrology * Geomorphology * Water quality * Habitat What is a Watershed? A watershed is a geographic area of land that drains waters to a shared destination. Watershed is a drainage basin that divides the landscape into hydrologically defined areas.
Polluted Runoff is the #1 Water Quality Problem in the U.S.* * USEPA
INTENSITY OF LANDUSE POTENTIAL WATER QUALITY PROBLEMS AMOUNT OF IMPERVIOUS SURFACE
Impervious Surfaces Materials like cement, asphalt, roofing, and compacted soil prevent percolation of runoff into the ground. The amount of impervious surface grows with increasing urbanization.
Derived at the University of Connecticut from 1995 Landsat TM Imagery Land Cover Comm./Ind. High Dense Res./Comm Turf/Lawn Mixed Res./ Tree cover Open/Agr. Open/Fields Conif. Forest Dec. Forest Forested Wetland Wetland/Marsh
Impervious surfaces • Indicate intensive land usesthat cause pollution • Inhibit recharge of groundwater • Prevent natural processing of pollutants in soil, plants • Provide a surface for accumulation of pollutants • Provide an express route for pollutants to waterways
Relationship Between % Imperviousness and Water Quality 80 70 60 50 40 30 20 10 0 WATERSHED IMPERVIOUSNESS (%) DEGRADED IMPACTED PROTECTED STREAM DEGRADATION ADAPTED FROM SCHUELER, ET. AL., 1992
Air Quality • Although improvements since the 1970 Clean Air Act, number of “unhealthy” days increasing for many metropolitan areas, especially in regards to ozone.
Relationship between HH density and VMT: J. Holtzclaw et al., Transportation Plann Technol 2002;25 (1):1-27.
Contribution of Highway Vehicles to Total U.S. Emissions of CO, NOx, and VOC, 1996 Source: Bureau of Transportation Statistics, U.S. DOT, 1998.
Air Quality Impacts Vehicle emissions also include CO2, fine particulate matter, and other toxic air pollutants, and are associated with increased risk of premature mortality, asthma, cancer and heart disease.
Pedestrian Safety In the US, it’s estimated that each year, automobiles cause about 5,000 – 6,000 fatalities and 80,000 – 120,000 injuries among pedestrians nationwide.
Urban form and physical activity • Urban form affects the relative convenience and viability of walking or biking for recreational, shopping, or work purposes – and thus influences the levels of physical activity patterns. • Only 30-40% of the American population engages in regular sustained exercise – another 30% are completely inactive! • Car dependency is associated with reduced walking or bicycling.
Obesity Trends* Among U.S. AdultsBRFSS, 1986 Source: Mokdad A H, et al. J Am Med Assoc1999;282:16, 2001;286:10.
Obesity Trends* Among U.S. AdultsBRFSS, 1987 Source: Mokdad A H, et al. J Am Med Assoc1999;282:16, 2001;286:10.
Obesity Trends* Among U.S. AdultsBRFSS, 1988 Source: Mokdad A H, et al. J Am Med Assoc1999;282:16, 2001;286:10.
Obesity Trends* Among U.S. AdultsBRFSS, 1989 Source: Mokdad A H, et al. J Am Med Assoc1999;282:16, 2001;286:10.
Obesity Trends* Among U.S. AdultsBRFSS, 1990 Source: Mokdad A H, et al. J Am Med Assoc1999;282:16, 2001;286:10.
Obesity Trends* Among U.S. AdultsBRFSS, 1991 Source: Mokdad A H, et al. J Am Med Assoc1999;282:16, 2001;286:10.
Obesity Trends* Among U.S. AdultsBRFSS, 1992 Source: Mokdad A H, et al. J Am Med Assoc1999;282:16, 2001;286:10.
Obesity Trends* Among U.S. AdultsBRFSS, 1993 Source: Mokdad A H, et al. J Am Med Assoc1999;282:16, 2001;286:10.
Obesity Trends* Among U.S. AdultsBRFSS, 1994 Source: Mokdad A H, et al. J Am Med Assoc1999;282:16, 2001;286:10.
Obesity Trends* Among U.S. AdultsBRFSS, 1995 Source: Mokdad A H, et al. J Am Med Assoc1999;282:16, 2001;286:10.
Obesity Trends* Among U.S. AdultsBRFSS, 1996 Source: Mokdad A H, et al. J Am Med Assoc1999;282:16, 2001;286:10.
Obesity Trends* Among U.S. AdultsBRFSS, 1997 Source: Mokdad A H, et al. J Am Med Assoc1999;282:16, 2001;286:10.
Obesity Trends* Among U.S. AdultsBRFSS, 1998 Source: Mokdad A H, et al. J Am Med Assoc1999;282:16, 2001;286:10.
Obesity Trends* Among U.S. AdultsBRFSS, 1999 Source: Mokdad A H, et al. J Am Med Assoc1999;282:16, 2001;286:10.
Obesity Trends* Among U.S. AdultsBRFSS, 2000 Source: Mokdad A H, et al. J Am Med Assoc1999;282:16, 2001;286:10.
Obesity Trends* Among U.S. AdultsBRFSS, 2001 Source: Mokdad A H, et al. J Am Med Assoc1999;282:16, 2001;286:10.
The “pedestrian pocket – a balanced, mixed-use area within a 5 minute walking radius of a transit station. Functions within this zone include housing, offices, retail, day care, recreation and parks.” These pockets support light rail systems that are pedestrian-friendly.