Download
1 / 1
10 likes | 135 Views
Investigating Differences between Same-Gender and Cross-Gender Mentoring Pairs: A Secondary Analysis of the IES Impact Evaluation Stella S. Kanchewa, Sarah R. Lowe, Jean E. Rhodes, PhD. Department of Psychology, University of Massachusetts Boston. Contact: skanchewa@gmail.com. Background

E N D
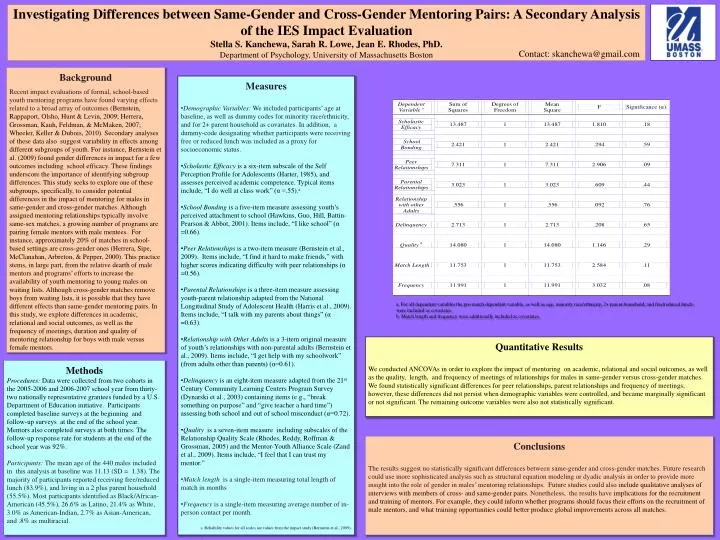
Investigating Differences between Same-Gender and Cross-Gender Mentoring Pairs: A Secondary Analysis of the IES Impact Evaluation Stella S. Kanchewa, Sarah R. Lowe, Jean E. Rhodes, PhD. Department of Psychology, University of Massachusetts Boston Contact: skanchewa@gmail.com Background Recent impact evaluations of formal, school-based youth mentoring programs have found varying effects related to a broad array of outcomes (Bernstein, Rappaport, Olsho, Hunt & Levin, 2009; Herrera, Grossman, Kauh, Feldman, & McMaken, 2007; Wheeler, Keller & Dubois, 2010). Secondary analyses of these data also suggest variability in effects among different subgroups of youth. For instance, Bernstein et al. (2009) found gender differences in impact for a few outcomes including school efficacy. These findings underscore the importance of identifying subgroup differences. This study seeks to explore one of these subgroups, specifically, to consider potential differences in the impact of mentoring for males in same-gender and cross-gender matches. Although assigned mentoring relationships typically involve same-sex matches, a growing number of programs are pairing female mentors with male mentees. For instance, approximately 20% of matches in school-based settings are cross-gender ones (Herrera, Sipe, McClanahan, Arbreton, & Pepper, 2000). This practice stems, in large part, from the relative dearth of male mentors and programs’ efforts to increase the availability of youth mentoring to young males on waiting lists. Although cross-gender matches remove boys from waiting lists, it is possible that they have different effects than same-gender mentoring pairs. In this study, we explore differences in academic, relational and social outcomes, as well as the frequency of meetings, duration and quality of mentoring relationship for boys with male versus female mentors. • Measures • Demographic Variables: We included participants’ age at baseline, as well as dummy codes for minority race/ethnicity, and for 2+ parent household as covariates. In addition, a dummy-code designating whether participants were receiving free or reduced lunch was included as a proxy for socioeconomic status. • Scholastic Efficacy is a six-item subscale of the Self Perception Profile for Adolescents (Harter, 1985), and assesses perceived academic competence. Typical items include, “I do well at class work” (α =.55).a • School Bonding is a five-item measure assessing youth’s perceived attachment to school (Hawkins, Guo, Hill, Battin-Pearson & Abbot, 2001). Items include, “I like school” (α =0.66). • Peer Relationships is a two-item measure (Bernstein et al., 2009). Items include, “I find it hard to make friends,” with higher scores indicating difficulty with peer relationships (α =0.56). • Parental Relationships is a three-item measure assessing youth-parent relationship adapted from the National Longitudinal Study of Adolescent Health (Harris et al., 2009). Items include, “I talk with my parents about things” (α =0.63). • Relationship with Other Adults is a 3-item original measure of youth’s relationships with non-parental adults (Bernstein et al., 2009). Items include, “I get help with my schoolwork” (from adults other than parents) (α=0.61). • Delinquency is an eight-item measure adapted from the 21st Century Community Learning Centers Program Survey (Dynarski et al., 2003) containing items (e.g., “break something on purpose” and “give teacher a hard time”) assessing both school and out of school misconduct (α=0.72). • Quality is a seven-item measure including subscales of the Relationship Quality Scale (Rhodes, Reddy, Roffman & Grossman, 2005) and the Mentor-Youth Alliance Scale (Zand et al., 2009). Items include, “I feel that I can trust my mentor.” • Match length is a single-item measuring total length of match in months • Frequency is a single-item measuring average number of in-person contact per month. • a. Reliability values for all scales are values from the impact study (Bernstein et al., 2009). a. For all dependent variables the pre-match dependent variable, as well as age, minority race/ethnicity, 2+ parent household, and free/reduced lunch were included as covariates. b. Match length and frequency were additionally included as covariates. Quantitative Results We conducted ANCOVAs in order to explore the impact of mentoring on academic, relational and social outcomes, as well as the quality, length, and frequency of meetings of relationships for males in same-gender versus cross-gender matches. We found statistically significant differences for peer relationships, parent relationships and frequency of meetings; however, these differences did not persist when demographic variables were controlled, and became marginally significant or not significant. The remaining outcome variables were also not statistically significant. • Methods • Procedures: Data were collected from two cohorts in the 2005-2006 and 2006-2007 school year from thirty-two nationally representative grantees funded by a U.S. Department of Education initiative. Participants completed baseline surveys at the beginning and follow-up surveys at the end of the school year. Mentors also completed surveys at both times. The follow-up response rate for students at the end of the school year was 92%. • Participants: The mean age of the 440 males included in this analysis at baseline was 11.13 (SD = 1.38). The majority of participants reported receiving free/reduced lunch (83.9%), and living in a 2 plus parent household (55.5%). Most participants identified as Black/African-American (45.5%), 26.6% as Latino, 21.4% as White, 3.0% as American-Indian, 2.7% as Asian-American, and .8% as multiracial. Conclusions The results suggest no statistically significant differences between same-gender and cross-gender matches. Future research could use more sophisticated analysis such as structural equation modeling or dyadic analysis in order to provide more insight into the role of gender in males’ mentoring relationships. Future studies could also include qualitative analyses of interviews with members of cross- and same-gender pairs. Nonetheless, the results have implications for the recruitment and training of mentors. For example, they could inform whether programs should focus their efforts on the recruitment of male mentors, and what training opportunities could better produce global improvements across all matches.