Download
1 / 18
180 likes | 182 Views
This study examines the prevalence and traffic patterns of handheld devices in campus Wi-Fi networks, with a focus on content access patterns and the impact on applications, device design, and network services.

E N D
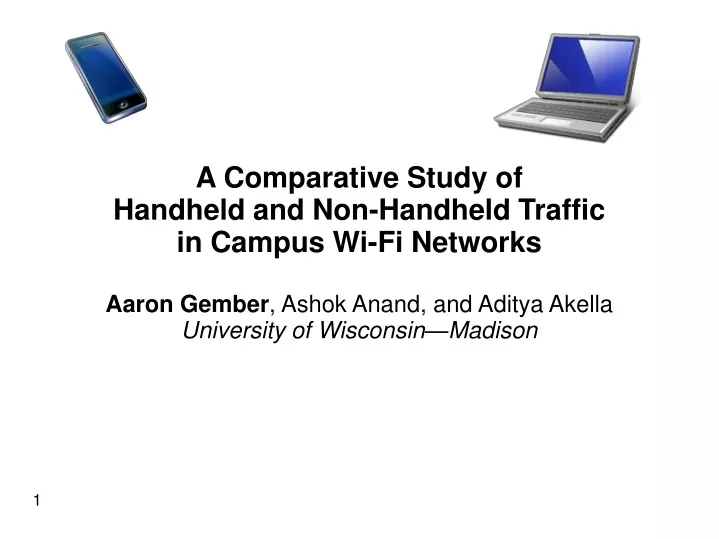
A Comparative Study of Handheld and Non-Handheld Traffic in Campus Wi-Fi Networks Aaron Gember, Ashok Anand, and Aditya Akella University of Wisconsin—Madison
Prevalence of Handhelds • 51% of undergrads own an Internet-capable handheld and 12% plan to purchase [EDUCASE 2009] • 73% increase in American handheld usage between 2007 and 2009 [PEW 2009] • 15% of clients in campus Wi-Fi networks are handhelds
Prior Studies • Traffic patterns in campus Wi-Fi [Comp. Net. 2008, Mob. Comp. Comm. 2005] • Most do not differentiate device types • Sessions, mobility, and protocol usage • Public Wi-Fi and 3G Networks [IMC 2008, 2009, 2010] • Application, session, and location trends • Little focus on content
Focus on Content • Content access patterns impact applications, device design, and network services • Uniqueness of handhelds • Small screens and limited battery • Content providers often tailor data Quantify and identify source of differences between handhelds and non-handhelds
Overview • Data sets and methodology • TCP flow properties • Web content • Streaming video flow properties • Content similarity
Data Sets and Methodology • Two campus networks for 3 days • Net1: 1,920 APs; 32,166 clients • Net2: 23 APs; 112 clients • Separate handhelds using HTTP User-Agent; confirm classification with OUIs 15% handhelds 7 primary vendors 70% Apple devices
Duration (sec) Median duration is equivalent Handhelds lack long flows TCP Flow Characteristics Size (KB) Handheld median is 50% of non-handheld Handhelds: more small flows & fewer large flows
Handhelds Smaller flows caused by smaller content being served Lack of long flows caused by short session durations Lack of low throughput caused by fewer interactive sessions TCP Flow Characteristics Throughput (Kbps) Equivalent median Handhelds have fewer low throughput flows Other factors the same
Web Content • 97% of handheld traffic is web (82% non-handheld) • 82% of HTTP handheld traffic is consumed by non-browser applications (10% non-handhelds) • Content details • Source web hosts • Content types
Top 10 Web Hosts Handheld Non-Handheld 42% of data from top 10 Content besides text and multimedia • 74% of data from top 10 • 8 of 10 serve multimedia
Web Content Types Handheld Non- handheld • Largest content type by volume • Handheld: video (42%), application (20%) • Non-handheld: image (29%), video (25%) • Application data is primarily octet-stream • Look in depth at streaming video
Duration (sec) Handheld video flows have a shorter median than all handheld flows and non-handheld video Streaming Video Flows Size (KB) Handheld video flows larger than all handheld flows, smaller than non-handheld video flows
Streaming Video Flows • Handheld video flows have high throughput • Look in depth at a single YouTube video • Handheld receives 7.3MB mp4 • Non-handheld receives 11.7MB flv • Same resolution for both • Size of sample video is much larger than median video flow size • Videos streamed over multiple, sequential connections • Users watch only a fraction of videos
Content Similarity • Chunk-level redundancy every 1 million packets • < 2% inter-user similarity for most traces • 5% to 25% intra-user similarity for half of traces • Greater amount of similarity in handhelds
Content Similarity • Intra-user similarity for top 100 handhelds • Up to 50% similarity, median 5% • Find most similarity with only 50MB cache
Questions? • See Tech Report for even more details • http://www.cs.wisc.edu/techreports/2010/TR1679.pdf
Top 10 Web Hosts • Top 10 hosts by number of requests • 30% of handheld requests (32% non-handheld) • Greater diversity of services in top hosts by request