Download
1 / 34
350 likes | 464 Views
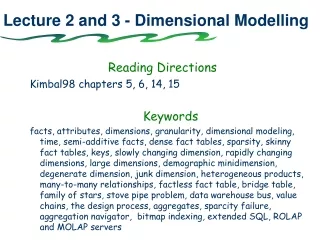
Dimensional Modelling. By Bob Timlin. Outline . What is a Multi-dimensional Database What is a data-warehouse Review ER-Diagrams Problems with ER for OLAP Purposes. Outline . What is Dimensional Modeling. Star Schemas (Facts and Dimensions) Star Schema vs. ER Diagram SQL Comparison.

E N D
Dimensional Modelling By Bob Timlin
Outline • What is a Multi-dimensional Database • What is a data-warehouse • Review ER-Diagrams • Problems with ER for OLAP Purposes
Outline • What is Dimensional Modeling. • Star Schemas (Facts and Dimensions) • Star Schema vs. ER Diagram • SQL Comparison
Outline (continued) • Strengths of Dimensional Modeling • Myths of Dimensional Modeling. • Designing the Data warehouse • Keys • References
What is a MDDB? An MDDB is a specialized data storage facility that stores summarized data for fast and easy access. Users can quickly view large amounts of data as a value at any cross-section of business dimensions. A business dimension can be any logical vision of the data -- time, geography, or product, for example. Once an MDDB is created, it can be copied or transported to any platform. In addition, regardless of where the MDDB resides, it is accessible to requesting applications on any supported platform anywhere on the network, including the Web.
MDDB (continued) MDDB can be implemented either on a proprietary MDDB product or as a dimensional model on a RDBMS. The later is the more common. For our purposes we will use Oracle 8i, a Relational Database.Proprietary MDDB database include Oracle’s Express, Arbor Essbase, Microsoft’s SQL Server OLAP component, etc.
What is a data warehouse? Data warehouses began in the 70’s out of the need of many companies to combine the data of it’s various operational systems into a useful and consistent form for analysis. Data-warehouses are used to provide data to Decision Support Systems (DSS). Many data-warehouses also work with OLAP (Online Analytical Processing) servers and clients. Data warehouses are updated only in batch not by transactions. They are optimized for SQL Selects. This optimization includes de-normalization.
DW (continued) • Inmon’s Four Characteristics of a Data Warehouse : • Subject-Oriented: DW’s answer a question, they don’t just store data. • Integrated: DW’s provide a unified view of the companies data. • Nonvolatile: DW’s are read-only for analytical purposes, de-normalization is ok. • Time: DW-Data is time sensitive. Analyze the past to predict the future.
Review of ER Modeling Entity-relationship modeling is a logical design technique that seeks to eliminate data redundancy and maintain the integrity of the database. They do this by highly normalizing the data. The more you normalize the more entities and relationships you wind up with. This is necessary in an online transaction processing (OLTP) system because insert, deletes, and updates against de-normalized data requires additional transactions to keep all the redundant data in sync. This is both highly inefficient and prone to errors. The ER Model is the best model for OLTP.
The Problem with ER Diagrams ER Diagrams are a spider web of all entities and their relationship to other entities throughout the database schema. Un-related relationships clutter the view of what you really want to get at. ER Diagrams are too complex for most end users to understand and because of all the joins required to get any meaningful data for analysis they are highly inefficient. Not useful for data-warehouses which need intuitive high performance retrieval of data.
What is Dimensional Modeling. Dimensional modeling is the name of a logical design technique often used for data-warehouses. Dimensional modeling is a logical design technique that seeks to present the data in a standard framework that is intuitive and allows for high-performance access. Dimensional modeling provides the best results for both ease of use and high performance.
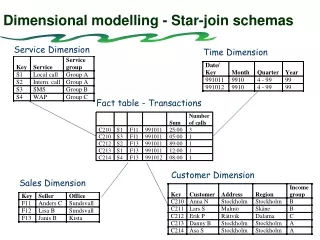
It uses the relational model with a few restrictions: Every dimension is composed of one table with a multi-part key, called the fact table, and a set of smaller tables called dimension tables. Each dimension has a single-part primary key that corresponds exactly to one of the components of the multi-part key in the fact table. This creates a structure that looks a lot like a star, hence the term “Star Schema” Interestingly early, late 60’s, implementations of relational databases looked a lot like Star Schema’s. They pre-dated ER Diagrams.
What is a Fact Table? A fact table is composed of two or more primary keys and usually also contains numeric data. Because it always contains at least two primary keys it is always a M-M relationship.
What is a Dimension? Dimension tables on the other hand have a primary key and only textual data or non-text data that is used for textual purposes. This data is used for descriptive purposes only. Each dimension is considered an equal entry point into the fact table. The textual attributes that describe things are organized within the dimensions. For example in a retail database we would have product, store, customer, promotion, and time dimensions. Whether or not to combine related dimensions into one dimensions is usually up to intuition. Remember however that guiding principal of dimensional modeling is 1. Intuitive Design, and 2. Performance.
Dimensions (continued) • Because Dimensions are the entry point into the facts that the user is looking for they should be very descriptive and intuitive to the user. Here are some rules: • Verbose (full words) • Descriptive • Complete (no missing values) • Quality assured (no misspellings, impossible values, obsolete or orphaned values, or cosmetically different versions of the same attribute) • Indexed (perhaps B-Tree or bitmap) • Documented in metadata that explains the origin and interpretation of each attribute.
SQL Comparison Dimensional Model: SELECT description, SUM(quoted_price), SUM(quantity), SUM(unit_price) , SUM(total_comm) FROM order_fact of JOIN part_dimension pd ON of.part_nr = pd.part_nr GROUP BY description; ER-Model: SELECT description, SUM(quoted_price), SUM(quantity), SUM(unit_price), SUM(total_comm) FROM order o JOIN order_detail od ON o.order_nr = od.order_nr JOIN part p ON p.part_nr = od.part_nr JOIN customer c ON o.customer_nr = c.customer_nr JOIN slsrep s ON s.slsrep_nr = c.slsrep_nr GROUP BY description; Notice that the dimensional model only joins two tables, while the ER model joins all five in the ER Diagram. This is very typical of highly normalized ER models. Imagine a typical normalized database with 100’s of tables
Rules about Facts and Dimensions: The Basic tenet of dimensional modeling: “If you want to be able to slice your data along a particular attribute, you simple need to make the attribute appear in a dimension table.” Facts and their corresponding Dimensions must be of the same granularity. Meaning if the fact table holds numerically data for days, then the dimensions must have factual attributes that describe daily data. An attribute can live in one and only one dimension, whereas a fact can be repeated in multiple fact tables. If a dimension appears to have more than one location, it is probably playing multiple roles and needs a slightly different textual description.
Rules (continued) There is not necessarily a one to one relation between source data and dimensional data, in fact usually one source will create multiple dimensions or multiple source data will create one dimension. Every fact should have a default aggregation. Even if that aggregation is No Aggregation.
ER to Dimensional Models • Separate each entity into the business process that it represents. • Create fact tables by selecting M-M relationships that contain numeric and additive non-key facts. Fact tables may be a detail level or at an aggregated level depending on business needs. • Create Dimensions by de-normalizing all the remaining tables into flat tables with atomic keys that connect directly to the fact tables. • Kimball: 146/147
Strengths of Dimensional Modeling • The Dimensional model is: • Predictable. Query tools can make strong assumptions about it. • Dynamic. • Extends Gracefully by adding rows or columns. • Standardized approach to modeling business events. • Growing number of software applications to support it. • Kimball: 147 to 149
Myths about Dimensional Modeling • Dimensional Models are non-dynamic: Only when you pre-aggregate. Kept in it’s detail form it is just as dynamic as ER. • Dimensional Models are too complex: Just the opposite • Snow flaking is an alternative to Dimensional Modeling: Snow flaking is an extension to the Star Schema. It adds sub-dimensions to dimensions and therefore looks like a snow-flake. It decreases the “simplicity” of the star-schema and should be avoided. • Kimball: 150/151
Designing the Data warehouse There are two approaches to building the data-warehouse. The first is the top-down approach. In this approach an entire organization wide data-warehouse is built and then smaller data-marts use it as a source. The second approach, which much more feasible, is the bottom-up approach. In this approach individual data-marts are built using conformed dimensions and a standardized architecture across the enterprise.
Design Success factors • Create a surrounding architecture that defines the scope and implementation of the complete data warehouse • Oversee the construction of each piece of the complete data warehouse. • Kimball in chapter five refers to a design called the data-warehouse bus architecture. • Kimball: 155
Drilling • There are two types of drilling • Drill down: Which simple means give me more detail, or a lower level of granularity. For example show sales figures for each county instead of for each state. • Drill up: Which simple means give me less detail, or a higher level of granularity. For example showing sales figures for each state instead of each county. • Most reporting/OLAP tools these days have this capability.
Special Types of Dimensions • Time dimension: Should be nation neutral. 176 • Person dimension: Very atomic, for example separate fields for all parts of name and address. 178 • Small Static (slowly changing) Dimensions. • Small Dynamic (rapidly changing) Dimensions. • Large Static (slowly changing) Dimensions. • Large Dynamic (rapidly changing) Dimensions. • Degenerate Dimensions: Dimensions without Attributes. • Miscellaneous Dimensions: Miscellaneous data that doesn’t fit anywhere else, but that you want to keep.
Keys It is best only to use artificial keys assigned by the data-warehouse, don’t use original production keys. Also avoid smart keys. Smart keys are keys that usually are also attributes.
Designing the Fact Table • Kimball defines a four step process. • Choose the data mart • Choose the fact table grain: Should be as granular as possible. • Choose the dimensions: Usually determined by the fact table. • Choose the facts of interest to you. • Kimball: 194
A data-mart is essentially a coordinated set of fact tables, all with similar structures. Kimball, 200
Granularity Detail granularity has several advantages over Aggregate granularity • More Dynamic • Required for data-mining • Allows for Behavior analysis (207/208) Aggregates offer increased performance when details are not needed. A best of both worlds can be achieved using something called a snapshot. In Oracle this is achieved using a Materialized View. Transactions and snapshots are the yin and yang of data-warehousing. Kimball: 211
REFERENCES:The Data Warehouse Lifecycle ToolkitAuthors: Ralph Kimball, Laura Reeves, Margy Ross, and Warren ThornthwaitePublisher: Wiley.ISBN: 0-471-25547-5Pay particular attention to chapters 5, 6, and 7.