Download
1 / 26
270 likes | 448 Views
DIMENSIONAL MODELLING. Overview. Clearly understand how the requirements definition determines data design Introduce dimensional modeling and contrast it with entity-relationship modeling Review the basics of the STAR schema

E N D
Overview • Clearly understand how the requirements definition determines data design • Introduce dimensional modeling and contrast it with entity-relationship modeling • Review the basics of the STAR schema • Find out what is inside the fact table and inside the dimension tables • Determine the advantages of the STAR schema for data warehouses • Review examples of the STAR schema
Comparison of ER and Dimensional Modeling ER Modeling Dimensional Modeling DW meant to answer questions on overall process DW focus is on how managers view the business DW reveals business trends Information is centered around a business process Answers show how the business measures the process The measures to be studied in many ways along several business dimensions Dimensional Modeling Captures critical measures Views along dimensions Intuitive to business users • OLTP systems capture details of events or transactions • OLTP systems focus on individual events • An OLTP system is a window into micro-level transactions • Picture at detail level necessary to run the business • Suitable only for questions at transaction level • Data consistency, non-redundancy, and efficient data storage critical • Entity-Relationship Modeling • Removes data redundancy • Ensures data consistency • Expresses microscopic relationships
Design Decisions for Dimensional Modeling • Choosing the Process : • Selecting the subjects from the information packages for the first set of logical structures to be designed. • Choosing the Grain : • Determining the level of detail for the data in the data structures. • Identifying and Conforming the Dimensions : • Choosing the business dimensions (such as product, market, time, etc.) to be included in the first set of structures and making sure that each particular data element in every business dimension is conformed to one another. • Choosing the Facts : • Selecting the metrics or units of measurements (such as product sale units, dollar sales, dollar revenue, etc.) to be included in the first set of structures. • Choosing the Duration of the Database : • Determining how far back in time you should go for historical data.
Dimensional Modeling • Modelling technique that aims to present the data in a standard, intuitive form that allows for high-performance access. • Uses the concepts of ER modelling with some important restrictions. • Every dimensional model (DM) is composed of one table with a composite primary key, called the fact table, and a set of smaller tables called dimension tables.
Dimensional Modeling • Design technique to structure the business dimensions and the metrics that are analyzed along these dimensions. • Provide high performance for queries and analysis • Multidimensional information package diagram is used to design the dimensional model. • Business dimensions • Facts and measurements
Information Packages : Auto Maker sales In the bottom section of the diagram, you observe the list of measurements or metrics that the automaker wants to use for analysis. Column headings are the business dimensions along which the automaker wants to analyze the measurements or metrics. Under each column heading you see the dimension hierarchies and categories within that business dimension. under each column heading are the attributes relating to that business dimension.
Dimensional Modeling • Dimensional model should represent three types of data entities. • measurements or metrics • business dimensions • Attributes for each business dimension
Dimensional Modeling • Each fact item or measurement goes into the fact table as an attribute. • fact table is derived from the information package diagram. • Other sections of the information package diagram, provide information on the business dimensions • Product • Dealer, • Customer demographics, • Payment method, • Time. • The product business dimension is used to analyze the facts by products. • Analysis can be broken down to individual models, • Analysis can be performed by product lines or product categories.
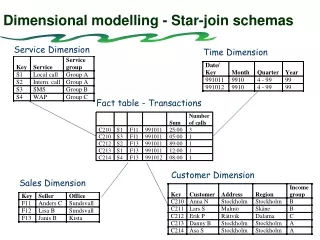
Dimensional Modeling : Star Schema • Each dimension table has a simple (non-composite) primary key that corresponds exactly to one of the components of the composite key in the fact table. • Forms ‘star-like’ structure, which is called a star schema or star join.
STAR SCHEMA • Star Schema (or Star Joint Schema) “A specific organization of a database in which a fact table with a composite key is joined to a number of single-level dimension tables, each with a single, primary key” -- Kimball Ralph, Data Warehouse Toolkit ---
Star Schema: Order Analysis Example Fact table containing measurements related to orders is shown in the middle of the schema diagram. salesperson order date Surrounding the fact table are the four dimension tables: customer product
Star Schema: Order Analysis Example • For a given amount of dollars, what was the product sold? • Who was the customer? Which salesperson brought the order? • When was the order placed?
STAR schema for order analysis • Point of view of the marketing department. • Users will analyze the orders using dollar amounts, cost, profit margin, and sold quantity. => fact table • Users will analyze these measurements by breaking down the numbers in combinations by customer, salesperson, date, and product => dimensions • The STAR schema structure can be easily understood by the users • Users can comfortably work with STAR schema
Star Schema • Mirrors how the users normally view their critical measures along their business dimensions. • From order dollars perspective, the STAR schema structure intuitively answers the questions of what, when, by whom, and to whom. • Users can easily visualize the answers to these questions: • For a given amount of dollars, what was the product sold Who was the customer? Which salesperson brought the order? When was the order placed? • When a query is made against the data warehouse, the results of the query are produced by combining or joining one of more dimension tables with the fact table. • The joins are between the fact table and individual dimension tables. • The relationship of a particular row in the fact table is with the rows in each dimension table. • These individual relationships are clearly shown as the spikes of the STAR schema.
What is the quantity sold and order dollars for product bigpart-1, relating to customers from the state of Maine, obtained by salesperson Jane Doe during the month of June Star Schema
Drill-Down Analysis from Star Schema Show me the total quantity sold of product brand big parts to customers in the northeast region for year 2008. Drill down to the level of quarters in 2008 for the northeast region. Drill down to individual products in that brand. Drill down to the level of details by individual states in the northeast region
Characteristics of a Dimension Table • Dimension Table Key : The primary key of the dimension table uniquely identifies each row in the table. • Table is Wide : Typically, a dimension table has many columns or attributes. Example: More than 50 attributes. • Textual Attributes : In the dimension table you will seldom find any numerical values used for calculations. The attributes in a dimension table are of textual format. • Users will compose their queries using these descriptors. • Attributes not Directly Related : Some of the attributes in a dimension table are not directly related to the other attributes in the table. Example, package size is not directly related to product brand but package size and product brand could both be attributes of the product dimension table.
Characteristics of a Dimension Table • Not Normalized : The attributes in a dimension table are used over and over again in queries. An attribute is taken as a constraint in a query and applied directly to the metrics in the fact table. • For efficient query performance, choose an attribute from the dimension table and go directly to the fact table • Drilling Down, Rolling Up : The attributes in a dimension table provide the ability to get to the details from higher levels of aggregation to lower levels of details. Example: zip code, city, and state form a hierarchy. • First get the total sales by state, then drill down to total sales by city, and then by zip code. • First get the totals by zip codes, and then roll up to totals by city and state. • Multiple Hierarchies : Possible to have more than one usually disjoint hierarchy. any of the multiple hierarchies. • Fewer Records. A dimension table typically has fewer records or rows than the fact table. Example: A product dimension table for an automaker may have just 500 rows. On the other hand, the fact table may contain millions of rows.
Characteristics of Fact Tables • Concatenated Key : A row in the fact table relates to a combination of rows from all the dimension tables. • A row in the fact table must be identified by the primary keys of all dimension tables. • Primary key of the fact table must be the concatenation of the primary keys of all the dimension tables. • Data Grain. The data grain is the level of detail for the measurements or metrics. • Fully Additive Measures:The values of these attributes may be summed up by simple addition. • Semiadditive Measures: Derived attributes are not additive.
Characteristics of Fact Tables • Table Deep, Not Wide: Typically a fact table contains fewer attributes than a dimension table. Usually, there are about 10 attributes or less. But the number of records in a fact table is very large in comparison. • Sparse Data : The fact table does not contain rows that do not have values for the measures. Understand that the fact table could have gaps. • Degenerate Dimensions: attributes for the dimension tables and the fact tables from operational systems, you will be left with some data elements in the operational systems that are neither facts nor strictly dimension attributes. Examples of such attributes are reference numbers like order numbers, invoice numbers, order line numbers, and so on. These attributes are useful in some types of analyses. For example, you may be looking for average number of products per order.