Download
1 / 42
420 likes | 500 Views
Communities of Excellence in Nutrition, Physical Activity and Obesity Prevention (CX 3 ) Santa Clara County: Mapping to Mobilization Santa Clara County Public Health Department Nutrition & Wellness. Bonnie Broderick MPH, RD Mary Foley von Ploennies MS, RD. Outline. Background

E N D
Communities of Excellence in Nutrition, Physical Activity and Obesity Prevention (CX3)Santa Clara County: Mapping to MobilizationSanta Clara County Public Health DepartmentNutrition & Wellness Bonnie Broderick MPH, RD Mary Foley von Ploennies MS, RD
Outline Background Approach and Implementation Neighborhood Snapshots Implications and Benefits Focus on Washington
Background on Santa Clara County and CX3
Size of Santa Clara County Land area of 1,315 square miles. As of July 1, 2006, the county’s population was approximately 1.73 million, making it the largest of the nine Bay Area counties.
What is CX3? Powerful tool to see how community “measures up” Identifies areas in need of improvement Community itself has a critical role to play Obesity prevention benchmarks – indicators and assets CX3 indicators and assets set standards of “excellence” Defines what a community itself should look like in order to prevent chronic diseases
Goal of CX3 Compile localized data to evaluate a community’s strengths and weaknesses in relation to CX3 indicators and assets. Set priorities based on local assessment data. Implement strategic, community-focused action plans. Evaluate progress over time
CX3 Focus on Neighborhood Environment 12 indicators used to paint a picture of the overall quality of nutrition and physical activity within a neighborhood. Are healthy food choices available and accessible to residents of low-income neighborhood? What is the density of fast food outlets in the neighborhood and around schools? How much and what type of nutrition marketing messages are around schools?
Benefits to Santa Clara County Places Santa Clara County neighborhoods in the forefront of obesity prevention. Provides standardized indicators that can be used by other local neighborhoods and by other communities throughout the state. Provides local communities with and objective, systematic, method to evaluate themselves. Engages local residents in advancing community change.
Approach and Implementation
Gilroy Nutrition Project How did we choose our neighborhoods? N & W Grants & Activities Partnerships & Collaborations The Health Trust Community Groups City of SJ Strong Neighborhoods Initiative SCC PHD Nutrition & Wellness Kaiser (HEAL Grant) Coalitions & Collaboratives Network Steps Leadership Team
How did we choose our neighborhoods? Short and long-term goals: reasons we are doing CX3 and what we want to do with the data. Focus on low-income neighborhoods in SCC that meet USDA FSNE eligibility (census tracts 50% at or below 185% FPL).
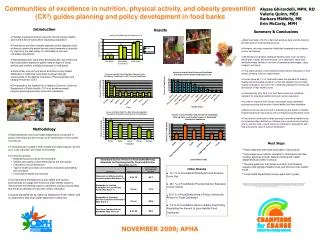
CX3 Neighborhoods In Santa Clara County, there were three CX3 pilot neighborhoods chosen All urban neighborhoods
California Nutrition Network GIS Map Washington Neighborhood (San Jose)2 Census Tracts
California Nutrition Network GIS MapUniversity Neighborhood (San Jose)4 Census Tracts
California Nutrition Network GIS MapChestnut Neighborhood (Gilroy)1 Census Tract
How did we approach the surveying and data collection? Engaged the community in the CX3 process by recruiting the help of Promotoras or“community health educators” from two local CBOs SCC staff and Promotores each concentrated on their strengths in the division of labor
Surveying and Data Collection Role and Responsibilities of: • SCC PHD Staff • Supermarket Access and Transit • Crime Statistics • Farmers’ Market • Food Banks • Alternative Food Outlets Promotoras Food Availability & Marketing Walkability Fast Food Advertising Outdoor Advertising
Data and Translation Field survey data sent to State CX3 Nutrition Network staff for analysis. Analysis results translated into Spanish for dissemination back to community. Attention given to language of results so that it was made more accessible to community members.
WASHINGTON • Population: 10,608 • Number of census tracts: 2 • 1 supermarket • Most of the stores are small • 7 out of 10 stores sell alcoholic beverages • More than half of the stores (55.5%) have 50 – 100% of their windows covered with unhealthy advertising • Most (83.3%) of fast food outlets <100 feet from the schools/parks
UNIVERSITY • Population: 18,155 • Number of census tracts: 4 • 2 supermarkets • Most of the stores are small stores or liquor stores • More than half of all the stores (55.6%) have unhealthy ads or promotions at the checkout| counter • Most stores (86%) sell 3 or fewer types of fruit
CHESTNUT • Population: 8,543 • Number of census tracts: 1 • 3 supermarkets • 25% of the stores were convenience stores, chain convenience • More than half of all the stores (64.3%) have unhealthy ads or promotions at the checkout counter • Had the second highest ratio of fast food outlets to population (1:777)
Neighborhood Snapshots Washington University Chestnut • STRENGTHS • Transportation to supermarkets are available and convenient. • High percentage of supermarkets and other stores were food stamp vendors. • The Food Bank serves all 3 neighborhoods and distributes fresh produce and canned fruit and vegetables every day.
Neighborhood Profile Snapshots Washington University Chestnut • WEAKNESSES: • High percentage of stores had unhealthy advertisements and promotions around check-out counter, below check-out level, on floor and hanging from the ceiling. • Most of the fruits and vegetables were of mixed quality, but more poor than good. • No outdoor advertising for healthy foods items or physical activity. • No Farmers’ Markets in either of the neighborhoods.
Benefits and Value of Participating in CX3 • The maps and surveys provide hard evidence to support what we may know intuitively about the relationship between food access, marketing and media and poverty in the community • Opens door to other opportunities & enhances partnerships • Presentation of neighborhood profiles and data back to all the Promotores
Has allowed for the creation of more effective scope of works and tailored nutrition education planning to improve effectiveness of interventions Gilroy Nutrition Project
Information being used for program planning Steps to a Healthier Santa Clara County City of SJ Strong Neighborhoods Initiative CX3 Data – San Jose (University & Washington)
Network Case Study • Focus on the Washington Neighborhood • Goal to empower the community; help residents advocate for making their community and neighborhood a healthier place to live • Set priorities based on the localizedassessment data • Implement strategic action plans to createenvironmental change in the community
Network Case Study Timeline • Community Engagement Process Phase I: Community Engagement Design (Feb 07) Phase II: CX3 Data Review & Interpretation (Mar 07) Phase III: Setting Priority Areas (Apr 07) Phase IV: Action Planning (current)
Network Case Study: Phase I Design • Community leaders and residents meet with SCCPHD staff to inform and refine design • Residents invited to participate • Draft community engagement process & review with community members • Revise community engagement design • Develop mechanisms to maintain participation from stakeholders
Network Case Study: Phase I • promotores in the Washington neighborhood • Individual meetings with community leaders • SIREN • Washington United Youth Center • La Biblioteca Latinoamericana • Washington Area Community Coalition • Washington Neighborhood Association • Gardner Neighborhood Association • Catholic Charities • Outreached to La Biblioteca Latinoamericana to post and disseminate information about efforts
Network Case Study: Phase II Data Review/Interpretation • Developed data presentation for community members that will engage them in the interpretation of the data • English & Spanish • Assets & needs • Where, why, & what • Pictures & maps
Network Case Study: Phase II • Conducted community data presentations with various groups in Washington neighborhood • Encouraged dialogue • Developed list of participants interested in continuing involvement • Compiled the initial responses to and interpretation of the data
Empowerment • Organizational & Community • SIREN • PHD • The Health Trust • Stanford Medical School • Catholic Charities • La Biblioteca Latinoamericana • City of San Jose Strong Neighborhoods • etc.
Empowerment First 5 • Organizational & Community La Biblioteca Kaiser HEAL grant Washington United Youth Center Catholic Charities Stanford Medical Students SIREN Alma Senior Center SCC PHD Nutrition & Wellness The Health Trust City of SJ Strong Neighborhoods Initiative Steps to a Healthier SCC NetworkLIA Gardner Community Center CX3 State Chestnut Washington Neighborhood University
Lessons Learned • Take time • Cultivate relationships • Gain trust • Additional small group meetings, perhaps prelude to community forum • Frame information • Fact sheets • Policy brief-share with policymakers • Attracts funders who can implement change
Lessons Learned • Community participation (promotores) invaluable & empowering • Need to perceive data as personally motivating • Balance maintain conversation & momentum while evaluating process • Tap further into faith-based organizations and additional community leaders
Next Steps • Take additional time to attend meetings in community & engage additional community groups • Invite local church participation • More personal, one-to-one contact to elicit further input • Need to reframe initial priority for sustainability? • Communicate & collaborate on multiple levels • Share data with city & county government
Contacts • Bonnie Broderick Bonnie.Broderick@hhs.sccgov.org • Mary Foley von Ploennies Mary.Foley@hhs.sccgov.org