Download
1 / 2
20 likes | 143 Views
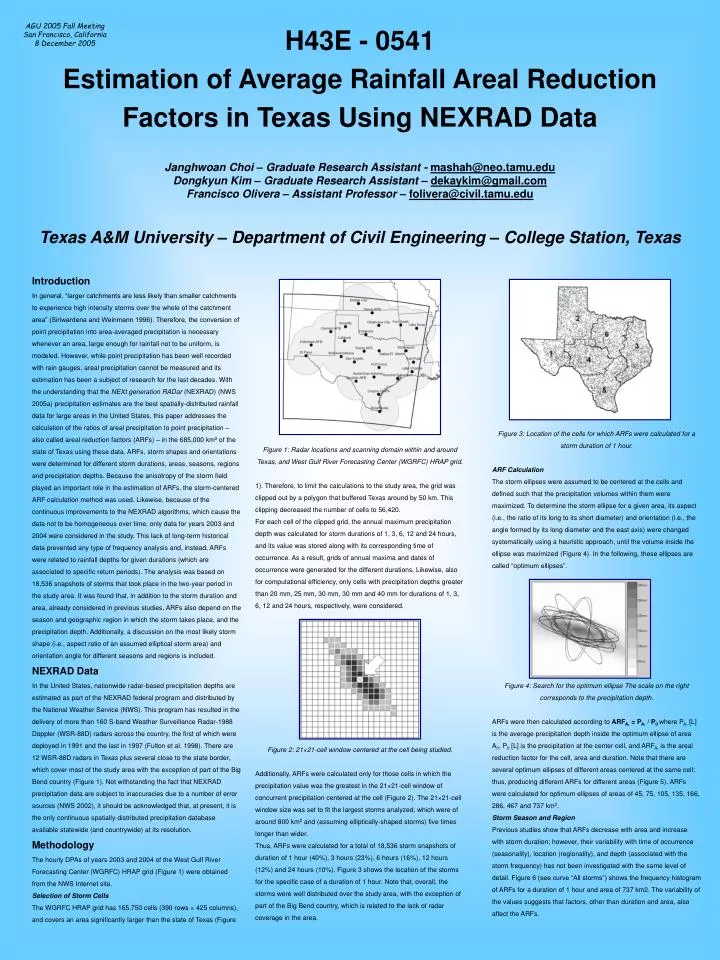
H43E - 0541 Estimation of Average Rainfall Areal Reduction Factors in Texas Using NEXRAD Data Janghwoan Choi – Graduate Research Assistant - mashah@neo.tamu.edu Dongkyun Kim – Graduate Research Assistant – dekaykim@gmail.com Francisco Olivera – Assistant Professor – folivera@civil.tamu.edu

E N D
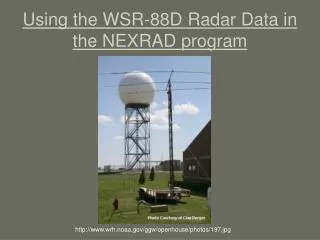
H43E - 0541 Estimation of Average Rainfall Areal Reduction Factors in Texas Using NEXRAD Data Janghwoan Choi – Graduate Research Assistant - mashah@neo.tamu.edu Dongkyun Kim – Graduate Research Assistant – dekaykim@gmail.com Francisco Olivera – Assistant Professor –folivera@civil.tamu.edu Texas A&M University – Department of Civil Engineering – College Station, Texas AGU 2005 Fall MeetingSan Francisco, California8 December 2005 Introduction In general, “larger catchments are less likely than smaller catchments to experience high intensity storms over the whole of the catchment area” (Siriwardena and Weinmann 1996). Therefore, the conversion of point precipitation into area-averaged precipitation is necessary whenever an area, large enough for rainfall not to be uniform, is modeled. However, while point precipitation has been well recorded with rain gauges, areal precipitation cannot be measured and its estimation has been a subject of research for the last decades. With the understanding that the NEXt generation RADar (NEXRAD) (NWS 2005a) precipitation estimates are the best spatially-distributed rainfall data for large areas in the United States, this paper addresses the calculation of the ratios of areal precipitation to point precipitation – also called areal reduction factors (ARFs) – in the 685,000 km2 of the state of Texas using these data. ARFs, storm shapes and orientations were determined for different storm durations, areas, seasons, regions and precipitation depths. Because the anisotropy of the storm field played an important role in the estimation of ARFs, the storm-centered ARF calculation method was used. Likewise, because of the continuous improvements to the NEXRAD algorithms, which cause the data not to be homogeneous over time, only data for years 2003 and 2004 were considered in the study. This lack of long-term historical data prevented any type of frequency analysis and, instead, ARFs were related to rainfall depths for given durations (which are associated to specific return periods). The analysis was based on 18,536 snapshots of storms that took place in the two-year period in the study area. It was found that, in addition to the storm duration and area, already considered in previous studies, ARFs also depend on the season and geographic region in which the storm takes place, and the precipitation depth. Additionally, a discussion on the most likely storm shape (i.e., aspect ratio of an assumed elliptical storm area) and orientation angle for different seasons and regions is included. NEXRAD Data In the United States, nationwide radar-based precipitation depths are estimated as part of the NEXRAD federal program and distributed by the National Weather Service (NWS). This program has resulted in the delivery of more than 160 S-band Weather Surveillance Radar-1988 Doppler (WSR-88D) radars across the country, the first of which were deployed in 1991 and the last in 1997 (Fulton et al. 1998). There are 12 WSR-88D radars in Texas plus several close to the state border, which cover most of the study area with the exception of part of the Big Bend country (Figure 1). Not withstanding the fact that NEXRAD precipitation data are subject to inaccuracies due to a number of error sources (NWS 2002), it should be acknowledged that, at present, it is the only continuous spatially-distributed precipitation database available statewide (and countrywide) at its resolution. Methodology The hourly DPAs of years 2003 and 2004 of the West Gulf River Forecasting Center (WGRFC) HRAP grid (Figure 1) were obtained from the NWS Internet site. Selection of Storm Cells The WGRFC HRAP grid has 165,750 cells (390 rows × 425 columns), and covers an area significantly larger than the state of Texas (Figure Figure 1: Radar locations and scanning domain within and around Texas, and West Gulf River Forecasting Center (WGRFC) HRAP grid. 1). Therefore, to limit the calculations to the study area, the grid was clipped out by a polygon that buffered Texas around by 50 km. This clipping decreased the number of cells to 56,420. For each cell of the clipped grid, the annual maximum precipitation depth was calculated for storm durations of 1, 3, 6, 12 and 24 hours, and its value was stored along with its corresponding time of occurrence. As a result, grids of annual maxima and dates of occurrence were generated for the different durations. Likewise, also for computational efficiency, only cells with precipitation depths greater than 20 mm, 25 mm, 30 mm, 30 mm and 40 mm for durations of 1, 3, 6, 12 and 24 hours, respectively, were considered. Figure 2: 21×21-cell window centered at the cell being studied. Additionally, ARFs were calculated only for those cells in which the precipitation value was the greatest in the 21×21-cell window of concurrent precipitation centered at the cell (Figure 2). The 21×21-cell window size was set to fit the largest storms analyzed, which were of around 800 km2 and (assuming elliptically-shaped storms) five times longer than wider. Thus, ARFs were calculated for a total of 18,536 storm snapshots of duration of 1 hour (40%), 3 hours (23%), 6 hours (16%), 12 hours (12%) and 24 hours (10%). Figure 3 shows the location of the storms for the specific case of a duration of 1 hour. Note that, overall, the storms were well distributed over the study area, with the exception of part of the Big Bend country, which is related to the lack of radar coverage in the area. Figure 3: Location of the cells for which ARFs were calculated for a storm duration of 1 hour. ARF Calculation The storm ellipses were assumed to be centered at the cells and defined such that the precipitation volumes within them were maximized. To determine the storm ellipse for a given area, its aspect (i.e., the ratio of its long to its short diameter) and orientation (i.e., the angle formed by its long diameter and the east axis) were changed systematically using a heuristic approach, until the volume inside the ellipse was maximized (Figure 4). In the following, these ellipses are called “optimum ellipses”. Figure 4: Search for the optimum ellipse The scale on the right corresponds to the precipitation depth. ARFs were then calculated according to ARFA0 = PA0 / P0where PA0 [L] is the average precipitation depth inside the optimum ellipse of area A0, P0 [L] is the precipitation at the center cell, and ARFA0 is the areal reduction factor for the cell, area and duration. Note that there are several optimum ellipses of different areas centered at the same cell; thus, producing different ARFs for different areas (Figure 5). ARFs were calculated for optimum ellipses of areas of 45, 75, 105, 135, 166, 286, 467 and 737 km2. Storm Season and Region Previous studies show that ARFs decrease with area and increase with storm duration; however, their variability with time of occurrence (seasonality), location (regionality), and depth (associated with the storm frequency) has not been investigated with the same level of detail. Figure 6 (see curve “All storms”) shows the frequency histogram of ARFs for a duration of 1 hour and area of 737 km2. The variability of the values suggests that factors, other than duration and area, also affect the ARFs.
Figure 5: Optimum ellipses of different areas for a given cell. Each ellipse has its own aspect and inclination angle. The scale on the right corresponds to the precipitation depth in mm. Summer was defined from April 23 to October 22 and winter from October 23 to April 22. Out of the 18,536 storms being studied, 85% took place in summer and 15% in winter. For the different storm durations, the percentage of summer storms ranged from 77% to 91%. Likewise, based on climate conditions, Texas was subdivided into six regions as shown in Figure 3. Out of the 18,536 storms, 11% corresponded to region #1, 24% to region #2, 19% to region #3, 15% to region #4, 17% to region #5 and 13% to region #6. In all cases, the percentage of summer storms ranged from 81% to 89%. Figure 6: ARF frequency distribution for storms of duration of 1 hour and area of 737 km2 in Texas. Precipitation Depth Once season and region were defined, the storms were subdivided into 480 subsets such that each of them contained records with the same storm duration, area, season and region (i.e., 5 × 8 × 2 × 6 combinations); and, after removing high leverage points and outliers, regression equations of the form ARF = b0 + b1 d were determined, where d [L] is the precipitation depth, and b0 (intercept) and b1 (slope) [1/L] are regression coefficients. In case the ARFs did not depend on the depth with a level of significance of 0.05, the slope of the line b1 was set equal to zero. Results Effect of depth, season and region It was found that the ARFs depended on the precipitation depth, with a significance level of 0.05, in regions #3, #4, #5 and #6 for summer storms (with a few exceptions); and did not depend on it, with a significance level of 0.05, in region #1 for winter storms. In all other cases, the dependency of the ARFs on precipitation depth changed with the storm duration, area and season, and no clear patterns were found. It was also found that the season (i.e., summer/winter) made a difference, with a level of significance of 0.05, in all regions except for a few cases in regions #1 and #6. Finally, it was observed that the datasets of regions #4 and #5 were not statistically different for summer storms, with a few exceptions. Therefore, regions #4 and #5 were merged into a single region for the analysis of summer storms. Figure 6 shows ARF histograms for 1-hour storms and areas of 737 km2 for different cases. It can be seen that the accounting of season, region and depth decreased the ARF variance from 0.16 for all storms (i.e., 7,479 storms), to 0.15 for summer storms (i.e., 6486 storms), to 0.14 for summer storms in region #4 (i.e., 938 storms), to 0.13 for summer storms in region #4 of precipitation depth in the range from 53 mm to 69 mm (i.e., 100 storms). Note, however, that ARF variability remains even after including season, region and depth in the analysis. Overall, for the different subsets, it was observed that the ARF variance were always lower than 0.19 and as low as 0.09 in specific cases, with the exception of winter storms in region #3 in which the variance was unusually high (i.e., 0.30). Figures 7, 8 and 9 show the effect of regionality, seasonality and precipitation depth on the ARF values. Figure 7: Effect of the geographic region on the ARF values. Figure 8: Effect of season on the ARF values. Figure 9: Effect of the precipitation depth on the ARF values. Aspect and angle of the optimum ellipses From the data available, it was possible to determine predominant storm ellipse aspect values and orientation angles, and their seasonal and regional distribution. Normalized histograms of aspect for the different regions and a duration of 1 hour are included in Figure 10. Similar histograms were prepared for durations of 3, 6, 12 and 24 hours, but were not included because of space limitations. In the histograms, it was noticed that around 30% of the ellipses correspond to aspect values between 1 and 2, which are almost-circular shapes; while the remaining had a more defined elliptical shape with aspect values greater than 2. This percentage was slightly higher for summer than for winter storms. It was also observed that the frequency decreased as the aspect increased, but increased again for the bin of 4.5 to 5. This abnormal increase was caused by the setting of 5 as the maximum aspect value in the determination of the optimum ellipses. Overall, patterns similar to those shown in Figure 10 were observed for other durations. Similarly, normalized histograms of the orientation angle for a duration of 1 hour are presented in Figure 11 for those ellipses with aspect greater than 2. The aspect threshold of 2 was used because the angle was considered trivial for almost-circular ellipses. Likewise, the histograms include only 737-km2 ellipses with the understanding that large ellipses capture better the orientation pattern of the rainfall field than the small ones. Again, similar histograms were prepared for durations of 3, 6, 12 and 24 hours, but were not included because of space limitations. In these histograms, an angle of 0° referred to an ellipse whose longer axis is parallel to the east direction, and angles are measured counterclockwise. It can be seen that winter storms (white bars) have a strong preference for southwest-northeast orientations (i.e., angles lower than 90°), with around 80% of them having these orientations. This preference, however, is weaker for summer storms (black bars) in which only around 60% have Figure 10: Aspect histograms for 1-hour storms. Black represents summer storms and white winter storms. southwest-northeast orientations. These distributions of the orientation angle were expected since convective lifting (predominant in summer storms) is an isotropic process, while frontal lifting (predominant in winter storms) assumes the orientation of the warm or cold front that causes it. These ellipse aspect and angle histograms confirm the anisotropic character of the precipitation fields and the need of accounting for it in the analysis. Figure 11: Orientation angle histogram for 1-hour storms. Black represents summer storms and white winter storms. Conclusions This paper discusses the estimation of precipitation ARFs in Texas using NEXRAD precipitation estimates. It was found that, in addition to the storm duration and area known for affecting the ARF values, the geographic region and season in which the storm takes place, and the precipitation depth also affect the ARFs. Overall, it was observed that winter storms caused by frontal lifting and storms with high precipitation depths have higher ARFs. After assuming elliptical storm shapes, ellipse aspects and orientations were studied. It was found that winter storms had a stronger tendency to have high aspect values (i.e., long frontal storms) and orientations somewhat parallel to the Texas gulf coast. References Fulton, R.A., J.P. Breidenbach, D.J. Seo, D.A. Miller and T. O’Bannon (1998), The WSR-88D Rainfall Algorithm, Weather and Forecasting 13: 377-395. Siriwardena, L. and P.E. Weinmann (1996), Derivation of areal reduction factors for design rainfalls in Victoria, Report 96/4, Cooperative Research Center for Catchment Hydrology, available online at http://www.catchment.crc.org.au/pdfs/technical199604.pdf as of 6/2/2005. Acknowledgements This research study was funded by the Texas Department of Transportation (TxDOT). The authors would like to thank Rose Marie Klee and David Stolpa with TxDOT, and Richard Fulton, Greg Shelton and Seann Reed with the National Weather Service (NWS) for their valuable input.