Download
1 / 47
500 likes | 1.11k Views
Probability Distribution Forecasts of a Continuous Variable. Meteorological Development Lab October 2007. Overview. Outputs Tools and concepts Data sets used Methods Results Case Study Conclusions Future Work. Uncertainty in Weather Forecasts.

E N D
Probability Distribution Forecasts of a Continuous Variable Meteorological Development Lab October 2007
Overview • Outputs • Tools and concepts • Data sets used • Methods • Results • Case Study • Conclusions • Future Work
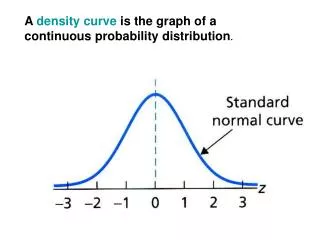
Uncertainty in Weather Forecasts It is being increasingly recognized that the uncertainty in weather forecasts should be quantified and furnished to users along with the single value forecasts usually provided. MDL’s goal is to provide probabilistic guidance for all surface weather variables in gridded form in the National Digital Guidance Database (NDGD).
Outputs How do we provide probabilistic forecasts to our customers and partners? • Fit a parametric distribution (e. g., Normal). • Economical, but restrictive • Enumerate Probability Density Function (PDF) or Cumulative Distribution Function (CDF) by computing probabilities for chosen values of the weather element. • Values must “work” everywhere • Enumerate Quantile Function (QF) by giving values of the weather element for chosen exceedence probabilities.
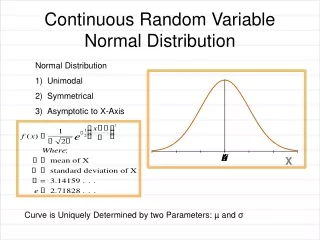
Chance of temperature below40.0 degrees F is 67.9%. Median of the distribution 38.3 degrees F. 50% Confidence Interval (35.8, 40.7) degrees F. 20% chance of temperature below 35.2 degrees F. 90% Confidence Interval (32.2,44.3) degrees F. One percent chance of temperature below 29.8 degrees F. 72-h T Fcst KBWI 12/14/2004
Tools and Concepts We have combined the following tools in a variety of ways to take advantage of linear regression and ensemble modeling of the atmosphere. • Error estimation in linear regression • Kernel Density Fitting (Estimation; KDE) A brief overview of these tools follows.
Error Estimation in Linear Regression • The linear regression theory used to produce MOS guidance forecasts includes error estimation. • The Confidence Interval quantifies uncertainty in the position of the regression line. • The Prediction Interval quantifies uncertainty in predictions made using the regression line. The prediction interval can be used to estimate uncertainty each time a MOS equation is used to make a forecast.
Estimated Variance of a Single New Independent Value • Estimated variance • Where
Computing the Prediction Interval The prediction bounds for a new prediction is where t(1-α/2;n-2) is the t distribution n-2 degrees of freedom at the 1-α (two-tailed) level of significance, and s(Ŷh(new)) can be approximated by where s2 is variance of the predictand r2 is the reduction of variance
Multiple Regression (3-predictor case) 3-predictor Matrix Predictand Vector Coefficient Vector
Multiple Regression, Continued Error bounds can be put around the new value of Y with where • s2 is the variance of the predictands, • R2 is the reduction of variance, • X’ is the matrix transpose of X, and • ()-1 indicates the matrix inverse.
Example: Confidence Intervals for Milwaukee, Wisconsin CI; Day 1 CI; Day 3 CI; Day 7
Example: Prediction Intervals for Milwaukee, Wisconsin PI; Day 1 PI; Day 3 PI; Day 7
Advantages of MOS Techniquesfor Assessing Uncertainty • Single valued forecasts and probability distributions come from a single consistent source. • Longer development sample can better model climatological variability. • Least squares technique is effective at producing reliable distributions.
Kernel Density Fitting • Used to estimate the Probability Density Function (PDF) of a random variable, given a sample of its population. • A kernel function is centered at each data point. • The kernels are then summed to generate a PDF. • Various kernel functions can be used. Smooth, unimodal functions with a peak at zero are most common.
Kernel Density Fitting A common problem is choosing the shape and width of the kernel functions. We’ve used the Normal Distribution and Prediction Interval, respectively.
Spread Adjustment Combination of prediction interval and spread in the ensembles can yield too much spread. Spread Adjustment attempts to correct over dispersion.
Weather Elements • Temperature and dew point, developed simultaneously • 3-h time projections for 7 days • Model data at 6-h time projections • 1650 stations, generally the same as GFS MOS • Maximum and minimum temperature • 15 days • Same stations
Global Ensemble Forecasting System Data Available for Ensemble MOS Development Cool Season 2004/05 Warm Season 2005 Cool Season 2005/06 Warm Season 2006 Cool Season 2006/07 Warm Season 2007 00Z 06Z 12Z 18Z 11-member era 15-memberera 21-mem. May 30, 2006 March 27, 2007 Development Data Independent Data Cool Season 10/01 – 03/31 Warm Season 04/01 – 09/30
Methods We explored a number of methods. Three are presented here.
Results • Will present results for cool season temperature forecasts developed with two seasons of development data and verified against one season of independent data. • Results center on reliability and accuracy. • The 0000 UTC cycle of the Global Ensemble Forecast System is the base model. • Results for dew point are available and very similar to temperature. • Results for maximum/minimum temperature are in process, and they are similar so far.
Probability Integral Transform (PIT) Histogram • Graphically assesses reliability for a set of probabilistic forecasts. Visually similar to Ranked Histogram. • Method • For each forecast-observation pair, probability associated with observed event is computed. • Frequency of occurrence for each probability is recorded in histogram as a ratio. • Histogram boundaries set to QF probability values. Ratio of 1.795 indicates ~9% of the observations fell into this category, rather than the desired 5%. Ratio of .809 indicates ~8% of the observations fell into this category, rather than the desired 10%. T=34F; p=.663
Probability Integral Transform (PIT) Histogram, Continued • Assessment • Flat histogram at unity indicates reliable, unbiased forecasts. • U-shaped histogram indicates under-dispersion in the forecasts. • O-shaped histogram indicates over-dispersion. • Higher values in higher percentages indicate a bias toward lower forecast values.
Squared Bias in Relative Frequency • Weighted average of squared differences between actual height and unity for all histogram bars. • Zero is ideal. • Summarizes histogram with one value. Sq Bias in RF = 0.057
Squared Bias in Relative Frequency • Diurnal cycle evident in early projections. • Use of ensemble mean as a predictor improves reliability at most time projections. • KDE technique seems to degrade reliability. • Model resolution change evident in latest projections.
Cumulative Reliability Diagram (CRD) • Graphically assesses reliability for a set of probabilistic forecasts. Visually similar to reliability diagrams for event-based probability forecasts. • Method • For each forecast-observation pair, probability associated with observed event is computed. • Cumulative distribution of verifying probabilities is plotted against the cumulative distribution of forecasts. 63.5% of the observations occurred when forecast probability was 70% for that temperature or colder.
Continuous Ranked Probability Score The formula for CRPS is where P(x) and Pa(x) are both CDFs and
Continuous Ranked Probability Score • Proper score that measures the accuracy of a set of probabilistic forecasts. • Squared differ-ence between the forecast CDFand a perfect single value forecast, inte-grated over all possible values of the variable. Units are those of the variable. • Zero indicates perfect accuracy. No upper bound.
Continuous Rank Probability Score • All techniques show considerable accuracy. • After Day 5 the 2 techniques that use ensembles show ~0.5 deg F improvement (~12 h).
Effects of Spread Adjustment Dependent data; No spread adjustment Dependent data; With spread adjustment Independent data; With spread adjustment Independent data; No spread adjustment
Grids • Temperature forecasts for 1650 stations can be used to generate grids. • Technique is identical to that used currently for gridded MOS. • Each grid is associated with an exceedence probability.
Case Study • 120-h Temperature forecast based on 0000 UTC 11/26/2006, valid 0000 UTC 12/1/2006. • Daily Weather Map at right is valid 12 h before verification time. • Cold front, inverted trough suggests a tricky forecast, especially for Day 5. • Ensembles showed considerable divergence.
Skew in Forecast Distributions 5 10° F 0
A “Rogue’s Gallery” of Forecast PDFs Baton Rouge, Louisiana Birmingham, Alabama Waco, Texas Bowling Green, Kentucky Greenwood, Mississippi Memphis, Tennessee
Conclusions • These techniques can capture the uncertainty in temperature forecasts and routinely forecast probability distributions. • Linear regression alone can be used to generate probability distributions from a single model run. • Means of ensemble output variables are useful predictors. • The Mn-Ens-KDE technique shows considerable promise, and it would be relatively easy to implement within the current MOS framework. • Enumerating the points of the quantile function is an effective way to disseminate probability distributions.
Future Work • Improve spread adjustment technique. • Examine characteristics of forecast distributions and their variation. • Verify individual stations. • Extend temperature, dew point, maximum/ minimum temperature development to four forecast cycles and two seasons. • Consider forecast sharpness and convergence as well as reliability and accuracy. • Create forecast distributions of QPF and wind speed. • Explore dissemination avenues.