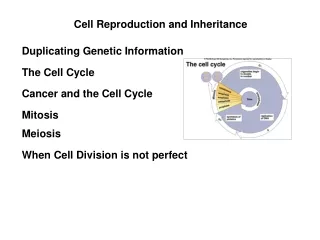
Download
1 / 1
10 likes | 102 Views
Partitioning Reference Intervals Using Genetic Information Brian H. Shirts 1 , Andrew R. Wilson 2 , Brian R. Jackson 1,2 1 Department of Pathology, University of Utah School of Medicine, 2 ARUP Institute for Clinical and Experimental Pathology, Salt Lake City, Utah. Abstract Background:

E N D
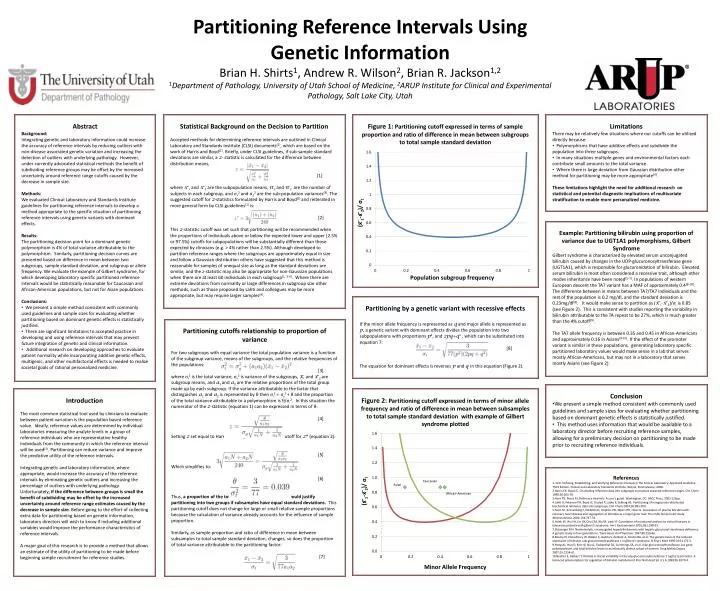
Partitioning Reference Intervals Using Genetic Information Brian H. Shirts1, Andrew R. Wilson2, Brian R. Jackson1,2 1Department of Pathology, University of Utah School of Medicine, 2ARUP Institute for Clinical and Experimental Pathology, Salt Lake City, Utah • Abstract • Background: • Integrating genetic and laboratory information could increase the accuracy of reference intervals by reducing outliers with non-disease associated genetic variation and increasing the detection of outliers with underlying pathology. However, under currently advocated statistical methods the benefit of subdividing reference groups may be offset by the increased uncertainty around reference range cutoffs caused by the decrease in sample size. • Methods: • We evaluated Clinical Laboratory and Standards Institute guidelines for partitioning reference intervals to develop a method appropriate to the specific situation of partitioning reference intervals using genetic variants with dominant effects. • Results: • The partitioning decision point for a dominant genetic polymorphism is 4% of total variance attributable to the polymorphism. Similarly, partitioning decision curves are presented based on difference in mean between two subgroups, sample standard deviation, and subgroup or allele frequency. We evaluate the example of Gilbert syndrome, for which developing laboratory specific partitioned reference intervals would be statistically reasonable for Caucasian and African-American populations, but not for Asian populations. • Conclusions: • We present a simple method consistent with commonly used guidelines and sample sizes for evaluating whether partitioning based on dominant genetic effects is statistically justified. • There are significant limitations to accepted practice in developing and using reference intervals that may prevent future integration of genetic and clinical information. • Additional research on developing approaches to evaluate patient normality while incorporating additive genetic effects, multigenic, and other multifactorial effects is needed to realize societal goals of rational personalized medicine. Statistical Background on the Decision to Partition Accepted methods for determining reference intervals are outlined in Clinical Laboratory and Standards Institute (CLSI) documents(1), which are based on the work of Harris and Boyd(2). Briefly, under CLSI guidelines, if sub-sample standard deviations are similar, a z- statistic is calculated for the difference between distribution means, [1] where x ̅1 and x ̅2 are the subpopulation means, n ̅1and n ̅2 are the number of subjects in each subgroup, and σ12 and σ22 are the sub-population variances(3). The suggested cutoff for z-statistics formulated by Harris and Boyd(2) and reiterated in more general form by CLSI guidelines(1) is: [2] This z-statistic cutoff was set such that partitioning will be recommended when the proportions of individuals above or below the expected lower and upper (2.5% or 97.5%) cutoffs for subpopulations will be substantially different than those expected by clinicians (e.g. > 4% rather than 2.5%). Although developed to partition reference ranges where the subgroups are approximately equal in size and follow a Gaussian distribution others have suggested that this method is reasonable for samples of unequal size as long as the standard deviations are similar, and the z-statistic may also be appropriate for non-Gaussian populations when there are at least 60 individuals in each subgroup(1, 3-4). Where there are extreme deviations from normality or large differences in subgroup size other methods, such as those proposed by Lahti and colleagues may be more appropriate, but may require larger samples(4). • Limitations • There may be relatively few situations where our cutoffs can be utilized directly because: • Polymorphisms that have additive effects and subdivide the population into three subgroups. • In many situations multiple genes and environmental factors each contribute small amounts to the total variance. • Where there is large deviation from Gaussian distribution other method for partitioning may be more appropriate(4). • These limitations highlight the need for additional research on statistical and potential diagnostic implications of multivariate stratification to enable more personalized medicine. Figure 1: Partitioning cutoff expressed in terms of sample proportion and ratio of difference in mean between subgroups to total sample standard deviation Example: Partitioning bilirubin using proportion of variance due to UGT1A1 polymorphisms, Gilbert Syndrome Gilbert syndrome is characterized by elevated serum unconjugated bilirubin caused by changes in the UDP-glucuronosyltransferase gene (UGT1A1), which is responsible for glucuronidation of bilirubin. Elevated serum bilirubin is most often considered a recessive trait, although other modes inheritance have been noted(5-7). In populations of western European descent the TA7 variant has a MAF of approximately 0.4(8-10). The difference between in means between TA7/TA7 individuals and the rest of the population is 0.2 mg/dl, and the standard deviation is 0.23mg/dl(8). It would make sense to partition as (x ̅1-x ̅2)/σt is 0.85 (see Figure 2). This is consistent with studies reporting the variability in bilirubin attributable to the TA repeat to be 27%, which is much greater than the 4% cutoff(9). The TA7 allele frequency is between 0.35 and 0.45 in African-Americans and approximately 0.16 in Asians(9-10). If the effect of the promoter variant is similar in these populations, generating laboratory specific partitioned laboratory values would make sense in a lab that serves mostly African-Americans, but may not in a laboratory that serves mostly Asians (see Figure 2). Partitioning by a genetic variant with recessive effects If the minor allele frequency is represented as q and major allele is represented as p, a genetic variant with dominant effects divides the population into two subpopulations with proportions p2, and 2pq+q2 , which can be substituted into equation 7: [8] The equation for dominant effects is reverses p and q in this equation (Figure 2). Partitioning cutoffs relationship to proportion of variance For two subgroups with equal variance the total population variance is a function of the subgroup variance, means of the subgroups, and the relative frequencies of the populations: [3] where σt2 is the total variance, σg2 is variance of the subgroups, x̅1 and x ̅2 are subgroup means, and a1 and a2 are the relative proportions of the total group made up by each subgroup. If the variance attributable to the factor that distinguishes a1 and a2 is represented by θ then σt2 = σg2 + θ and the proportion of the total variance attributable to a polymorphism is θ/σt2. In this situation the numerator of the z-statistic (equation 1) can be expressed in terms of θ: [4] Setting z set equal to Harris and Boyd’s recommended cutoff for z* (equation 2): [5] Which simplifies to: [6] Thus, a proportion of the total variance of 4% or greater would justify partitioning into two groups if subsamples have equal standard deviations. This partitioning cutoff does not change for large or small relative sample proportions because the calculation of variance already accounts for the influence of sample proportion. Similarly, as sample proportion and ratio of difference in mean between subsamples to total sample standard deviation, changes, so does the proportion of total variance attributable to the partitioning factor: [7] • Conclusion • We present a simple method consistent with commonly used guidelines and sample sizes for evaluating whether partitioning based on dominant genetic effects is statistically justified. • This method uses information that would be available to a laboratory director before recruiting reference samples, allowing for a preliminary decision on partitioning to be made prior to recruiting reference individuals. Introduction The most common statistical tool used by clinicians to evaluate between patient variation is the population based reference value. Ideally, reference values are determined by individual laboratories measuring the analyte levels in a group of reference individuals who are representative healthy individuals from the community in which the reference interval will be used(1). Partitioning can reduce variance and improve the predictive utility of the reference intervals. Integrating genetic and laboratory information, where appropriate, would increase the accuracy of the reference intervals by eliminating genetic outliers and increasing the percentage of outliers with underlying pathology. Unfortunately, if the difference between groups is small the benefit of subdividing may be offset by the increased uncertainty around reference range estimates caused by the decrease in sample size. Before going to the effort of collecting extra data for partitioning based on genetic information, laboratory directors will wish to know if including additional variables would improve the performance characteristics of reference intervals. A major goal of this research is to provide a method that allows an estimate of the utility of partitioning to be made before beginning sample recruitment for reference studies. Figure 2: Partitioning cutoff expressed in terms of minor allele frequency and ratio of difference in mean between subsamples to total sample standard deviation with example of Gilbert syndrome plotted References 1. CLSI. Defining, Establishing, and Verifying Reference Intervals in the Clinical Laboratory; Approved Guideline - Third Edition. Clinical and Laboratory Standards Institute, Wayne, Pennsylvania; 2008. 2.Harris EK, Boyd JC. On dividing reference data into subgroups to produce separate reference ranges. Clin Chem 1990;36:265-70. 3.Horn PS, Pesce AJ. Reference intervals: A user's guide. Washington, DC: AACC Press, 2005:123pp. 4.Lahti A, Petersen PH, Boyd JC, Rustad P, Laake P, Solberg HE. Partitioning of nongaussian-distributed biochemical reference data into subgroups. Clin Chem 2004;50:891-900. 5.Hunt SC, Kronenberg F, Eckfeldt JH, Hopkins PN, Myers RH, Heiss G. Association of plasma bilirubin with coronary heart disease and segregation of bilirubin as a major gene trait: The nhlbi family heart study. Atherosclerosis 2001;154:747-54. 6.Hsieh SY, Wu YH, Lin DY, Chu CM, Wu M, Liaw YF. Correlation of mutational analysis to clinical features in taiwanese patients with gilbert's syndrome. Am J Gastroenterol 2001;96:1188-93. 7.Sleisenger MH. Nonhemolytic unconjugated hyperbilirubinemia with hepatic glucuronyl transferase deficiency: A genetic study in four generations. Trans Assoc Am Physicians 1967;80:259-66. 8.Bosma PJ, Chowdhury JR, Bakker C, Gantla S, de Boer A, Oostra BA, et al. The genetic basis of the reduced expression of bilirubin udp-glucuronosyltransferase 1 in gilbert's syndrome. N Engl J Med 1995;333:1171-5. 9.Hong AL, Huo D, Kim HJ, Niu Q, Fackenthal DL, Cummings SA, et al. Udp-glucuronosyltransferase 1a1 gene polymorphisms and total bilirubin levels in an ethnically diverse cohort of women. Drug Metab Dispos 2007;35:1254-61. 10.Beutler E, Gelbart T, Demina A. Racial variability in the udp-glucuronosyltransferase 1 (ugt1a1) promoter: A balanced polymorphism for regulation of bilirubin metabolism? Proc Natl Acad Sci U S A 1998;95:8170-4.