Download
1 / 35
750 likes | 1.6k Views
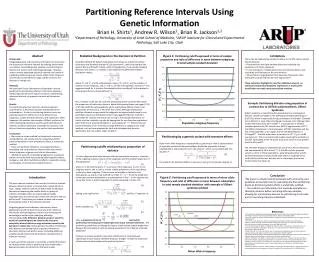
Reference Intervals for routine biochemical analytes in healthy Indian volunteers : C-RIDL IFCC Initiative .

E N D
Reference Intervals for routine biochemical analytes in healthy Indian volunteers : C-RIDL IFCC Initiative SWARUP SHAH, KIYOSHI ICHIHARA*, REO KAWANA*, ALPA DHERAI, TESTER F. ASHAVAIDP. D. Hinduja National Hospital and Medical Research Center, Mumbai, India*Yamaguchi University Graduate School of Medicine, Ube, Japan
REFERENCE INTERVALS (RI) • The interval between and including two numbers, an upper and lower reference limit. NEED FOR REFERENCE VALUES: - Comparison data for clinical interpretation - Medical diagnosis - Therapeutic management 97.5th percentile UPPER LIMIT 2.5th percentile LOWER LIMIT 95% ReferenceInterval
RI : OVERVIEW 3 2 4 5 6 1 Aytekin M &Emerk K: eJIFCC, 2008, 19(2)
RI : INDIAN SCENARIO • Most laboratories in India refer to reference values either from • manufacturers kit inserts& /or • scientific literatureprimarily based on western population. • Populations differphysiologically, genetically and ethnically. • Thus it would be inappropriateto use reference intervals that do not represent the population.
In 2012… Collaboration between the IFCC C-RIDL and Hinduja Hospital Worldwide Multicenter study on Reference Values : Indian perspective TESTER F. ASHAVAID, SWARUP SHAH, REO KAWANA, ALPA DHERAI, KIYOSHI ICHIHARA ,
IFCC ONGOING GLOBAL STUDY ON RI 18 COUNTRIES – IN COLLABORATION
AIMS & OBJECTIVES • Objectives: • Investigate thefeasibility of deriving “common” RIs for a large number of analytes on a global scale. • Establish unbiased and reproducible RIs from a large number of healthy individuals. • Explore sources of variations of test results by use of information obtained from the questionnaire, and the associations among test results of selected analytes.
HINDUJA HOSPITAL: DETAILED RESEARCH PLAN
IFCC INCLUSION – EXCLUSION CRITERIA • Inclusion criteria: 1. Subjects between 18 – 65 years of age 2. Be healthy and no medications / within IFCC acceptable criteria. • Exclusion criteria: 1. Known diabetes on oral / insulin therapy. 2. History of chronic liver or kidney disease 3. Any blood results indicating to a severe disease 4. Blood donated in the previous 3 months 5. Known carrier of HIV, HBV or HCV 6. Female subjects who are pregnant or within one year after childbirth. 7. Volunteered in a research study involving a investigational product in the past 3 months. 8. Hospitalized as a in-patient or seriously ill in the previous 4 weeks. 9. Any other significant disease which in opinion of the investigator might influence the result of the study. Orzada Y. ClinChem Lab Med. 2013 May;51(5):1027-40
STUDY OUTLINE Approaching Hinduja Hospital employees as prospective volunteers Assessing the volunteer’s suitability using the Inclusion-exclusion criteria Written and verbal information on the study is given to the volunteer Date for blood collection along with instructions is informed to the volunteer On the day of blood collection, Consent, Health-status information is obtained from to the volunteer Serum aliquoting and storage at -80°C until analysis Estimation of 49target analytes
ESTIMATION OF ANALYTES (total 49analytes) BECKMAN COULTER ANALYZERS (33 analytes)
ESTIMATION OF ANALYTES (total 49analytes) BECKMAN COULTER ANALYZERS (33 analytes) ABBOTT ANALYZER (16 analytes)
QUALITY CONTROL • As per the CAP and NABL quality control specifications : Calibrationfor both the analyzers for all the 49 analytes were carried out. Controlswere run for each analytes at both normal and pathological concentrations before and during the run. • Cross comparison of values: A panel of 40 sera was provided from Japan to each of the participating 27 countries to be tested along with the serum specimen. To align our laboratory results with results across the world. • Quality control monitoring: A mini-panel of sera from 5 healthy volunteers was prepared. This panel was included with every batch of serum specimen that is analyzed. To monitor between – day variation in test results.
Statistical Approach • All the data from across the world were sent to Prof K. Ichihara for the complete statistical analysis • Both Parametric and Non-parametric methods were used for derivation of RI using with (+) / without (-) LAVE Parametric Nonparametric (Gaussian Distribution) (Non-Gaussian Distribution ) 95% CENTRAL 95% OF THE REFERENCE VALUES
Detection of Outlying observation / Outliers Latent Abnormal Value Exclusion (LAVE) method: • An iterative approach to derive reference intervals simultaneously for multiple analytes. • This method was developed to exclude abnormal results hidden within the reference values. Ichihara K, ClinChemActa. 2014 May 15;432:108-18
How to exclude latent abnormal results? 1 0 1 0 0 3 0 0 0 0 0 0 0 0 0 Reference individuals Latent Abnormal Value Exclusion (LAVE)Method Apparently healthy individuals Exclusion of those with abnormal results in basic tests other than UA. After exclusion Original distribution ofUA 1 abnormal results 3 abnormal results 4 abnorml results 1 3 1 1 4 UA Reference Interval Reference interval UA
Statistical Approach • Both Parametric and Non-parametric methods were used for derivation of RI using with (+) / without (-) LAVE. • Multiple Regression analysis (MRA) & 3-level Nested ANOVA was used to analyze potential source of variation (age, gender, BMI etc.,) and gender partitioning respectively. • Statflex 6.0 software was used to analyze all the data.
SOURCES OF VARIATION ANALYSIS MULTIPLE REGRESSION ANALYSIS Negative correlation ; Positive correlation
SOURCES OF VARIATION ANALYSIS MULTIPLE REGRESSION ANALYSIS Negative correlation ; Positive correlation
Gender Partitioning Recommended (7 Analytes) Strongly Recommended (15 Analytes) 27 ANALYTES PARTITIONING NOT REQUIRED 22 ANALYTES SDR > 0.3 = Gender Partition
IMPORTANCE OF LAVE • Great reduction in the upper limit of the RI for most analytes when LAVE was used • Generally Parametric RI Narrower than Nonparametric RI
REPORTED RI v/s PRESENT STUDY RI Except GGT, BUN and UA – no other showed considerable difference between reported and study RI Lipids markers were found to be Higher than the reported
REPORTED RI v/s PRESENT STUDY RI CK and AMY FT3 and FT4 CA125 CA19.9 tPSA
REPORTED RI v/s PRESENT STUDY RI IgG, IgA & IgM were higher
Conclusion…. • A comprehensive picture of RI for the 49 analytes in healthy Indian subjects. • Generally parametric method along with LAVE tend to produce a narrow RIs. • Age and BMI were common source of variation for many analytes. • Gender partitioning recommended for 22 out of the 49 analytes studied. Interestingly certain analytes, Immunoglobulins, nutritional and bone markers showed MARKED DIFFERENCE from the literature indicating a strong influence of regionality in Indian subjects.
Thank you… P. D. HINDUJA NATIONAL HOSPITAL & MEDICAL RESEARCH CENTRE
Detection of Outlying observation / Outliers • Most commonly used statistical techniques are available for detection of outliers are A. Dixon test B. Tukey method C. Latent Abnormal Exclusion Value (LAVE) A. Dixon method: D D ≤ R/3 Min Max R Not an Outlier D Min Max D ≥R/3 R Outlier
Detection of Outlying observation / Outliers B. Tukey method: 25th 50th 75th Median Q1 Q3 UPPER BOUNDARY [Q3 + 1.5 x IQR] LOWER BOUNDARY [Q1 - 1.5 x IQR] Inter-quartile range (IQR) Outlier