Download
1 / 94
960 likes | 1.15k Views
Strategies for Information Extraction and Artifact Reduction in Functional MRI. Peter A. Bandettini, Ph.D Unit on Functional Imaging Methods & 3T Neuroimaging Core Facility Laboratory of Brain and Cognition National Institute of Mental Health. Categories of Questions Asked with fMRI.

E N D
Strategies for Information Extraction and Artifact Reduction in Functional MRI Peter A. Bandettini, Ph.D Unit on Functional Imaging Methods & 3T Neuroimaging Core Facility Laboratory of Brain and Cognition National Institute of Mental Health
Categories of Questions Asked with fMRI Where? When? How much? --- How to get the brain to do what we want it to do in the context of an fMRI experiment? (limitations: limited time and signal to noise, motion, acoustic noise)
A Primary Challenge: ...to make progressively more precise inferences using fMRI without making too many assumptions about non-neuronal physiologic factors.
Neuronal Measured Activation fMRI Signal ? ? Hemodynamics Physiologic Factors
Physiologic Factors that Influence BOLD Contrast • Blood oxygenation • Blood volume • Blood pressure • Hematocrit • Vessel size Coupling: Flow & CMRO2
Contrast in Functional MRI • Blood Volume • Contrast agent injection and time series collection of T2* or T2 - weighted images • BOLD • Time series collection of T2* or T2 - weighted images • Perfusion • T1 weighting • Arterial spin labeling
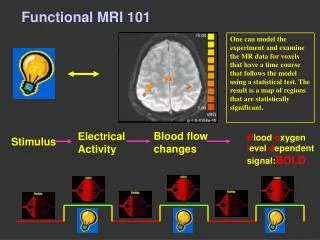
BOLD Contrast in the Detection of Neuronal Activity Cerebral Tissue Activation Local Vasodilation Oxygen Delivery Exceeds Metabolic Need Increase in Cerebral Blood Flow and Volume Increase in Capillary and Venous Blood Oxygenation Deoxy-hemoglobin: paramagnetic Oxy-hemoglobin: diamagnetic Decrease in Deoxy-hemoglobin Decrease in susceptibility-related intravoxel dephasing Increase in T2 and T2* Local Signal Increase in T2 and T2* - weighted sequences
The BOLD Signal Blood Oxygenation Level Dependent (BOLD) signal changes task task
Perfusion / Flow Imaging EPISTAR FAIR . . . - - - - Perfusion Time Series . . .
TI (ms) 200 400 600 800 1000 1200 FAIR EPISTAR
Scanner and Hemodynamic Limits
Single Shot Imaging T2* decay EPI Readout Window ≈ 20 to 40 ms
T2* decay EPI Window 1 Multishot Imaging T2* decay EPI Window 2
Multi Shot EPI Excitations 1 2 4 8 Matrix Size 64 x 64 128 x 128 256 x 128 256 x 256
T2* decay EPI Window Partial k-space imaging
Perfusion Rest Activation BOLD
Anatomy BOLD Perfusion
Hemodynamic Specificity Arterial inflow (BOLD TR < 500 ms) Venous inflow (Perf. No VN)
+- • unique information • baseline information • multislice trivial • invasive • low C / N for func. Volume BOLD Perfusion • highest C / N • easy to implement • multislice trivial • non invasive • highest temp. res. • complicated signal • no baseline info. • unique information • control over ves. size • baseline information • non invasive • multislice non trivial • lower temp. res. • low C / N
20 3 15 2 10 BOLD (% increase) CBF (% increase) 5 1 0 0 -5 -10 0 200 400 600 800 1000 1200 1400 0 200 400 600 800 1000 1200 1400 Time (seconds) Time (seconds) hypercapnia visual stimulation Hoge, et al. CMRO2-related BOLD signal deficit: CBF BOLD Simultaneous Perfusion and BOLD imaging during graded visual activation and hypercapnia N=12
4 +10 +20 -10 0 25 3 20 15 CMRO2 (% increase) BOLD (% increase) 2 10 5 1 0 0 10 20 30 40 50 Perfusion (% increase) 0 0 10 20 30 40 50 Perfusion (% increase) Hoge, et al. CBF-CMRO2 coupling Characterizing Activation-induced CMRO2 changes using calibration with hypercapnia
Hoge, et al. Computed CMRO2 changes 40 30 20 10 0 % % -10 -20 -30 -40 Subject 2 Subject 1
2 1000 msec 1.5 100 msec 34 msec 1 0.5 0 -0.5 -1 15 20 25 30 35 Time (sec)
20 s 2000 ms 1000 ms 500 ms 250 ms 0 10 20 30 40 0 10 20 30 40 BOLD response is nonlinear Observed response Linear response Short duration stimuli produce larger responses than expected
Source of the Nonlinearity • Neuronal • Hemodynamic • Miller et al. 1998 – Flow is linear, BOLD is nonlinear • Friston et al. 2000 – hemodynamics can explain nonlinearity If nonlinearity is hemodynamic in origin, a measure of this nonlinearity will reflect any spatial variation of the vasculature
Methods Motor Visual Stimulus Duration (SD) … SD = 500 ms SD = 250 ms … SD = 1000 ms SD = 500 ms … SD = 2000 ms SD = 1000 ms … SD = 4000 ms SD = 2000 ms 16 s … Blocked Trial 20 s
Observed Responses measured ideal (linear) visual stimulation 250 ms 500 ms 1000 ms 2000 ms motor task 500 ms 1000 ms 2000 ms 4000 ms
a t Compute nonlinearity (for each voxel) • Amplitude of Response Fit ideal (linear) to response • Area under response / Stimulus Duration Output Area / Input Area
6 6 4 f (SD) 4 f (SD) 2 2 0 1 2 3 4 5 0 1 2 3 4 5 Stimulus Duration Stimulus Duration 6 5 4 4 3 2 2 1 0 1 2 3 4 5 0 1 2 3 4 5 Nonlinearity Visual Motor Magnitude linear Area Output / input Output / input Stimulus Duration Stimulus Duration
Results – visual task Nonlinearity Magnitude Latency
Results – motor task Nonlinearity Magnitude Latency
8 f (SD) 6 4 2 0 10 20 30 40 0 1 2 3 4 5 0 10 20 30 40 Stimulus Duration -2 8 f (SD) 6 60 4 40 2 20 0 1 2 3 4 5 0 2 0 2 4 6 8 Stimulus Duration -2 nonlinearity Results – visual task
8 f (SD) 6 4 2 60 0 10 20 30 40 0 10 20 30 40 40 0 1 2 3 4 5 Stimulus Duration 20 0 2 0 2 4 6 8 nonlinearity Results – motor task 8 f (SD) 6 4 2 0 1 2 3 4 5 Stimulus Duration
Reproducibility Visual task Motor task Nonlinearity1 Nonlinearity1 Nonlinearity2 Nonlinearity2 Experiment 1 Experiment 2 Experiment 1 Experiment 2
+ 2 sec Latency - 2 sec Magnitude
Regions of Interest Used for Hemi-Field Experiment Left Hemisphere Right Hemisphere
9.0 seconds 15 seconds 500 msec 500 msec 20 30 10 Time (seconds)
3.2 2.4 1.6 0.8 0 -0.8 -1.6 -2.4 0 10 20 30 Hemi-field with 500 msec asynchrony Average of 6 runs Standard Deviations Shown Percent MR Signal Strength Time (seconds)