Download
1 / 57
580 likes | 737 Views
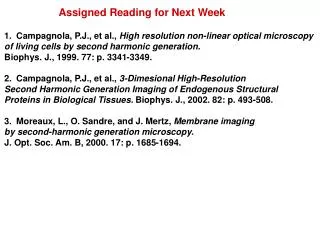
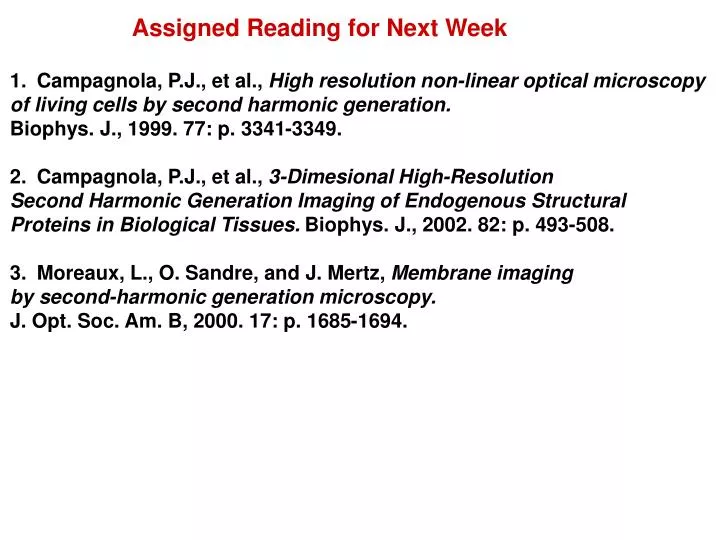
Assigned Reading for Next Week. Campagnola, P.J., et al., High resolution non-linear optical microscopy of living cells by second harmonic generation. Biophys. J., 1999. 77: p. 3341-3349. Campagnola, P.J., et al., 3-Dimesional High-Resolution

E N D
Assigned Reading for Next Week • Campagnola, P.J., et al., High resolution non-linear optical microscopy • of living cells by second harmonic generation. • Biophys. J., 1999. 77: p. 3341-3349. • Campagnola, P.J., et al., 3-Dimesional High-Resolution • Second Harmonic Generation Imaging of Endogenous Structural • Proteins in Biological Tissues. Biophys. J., 2002. 82: p. 493-508. • Moreaux, L., O. Sandre, and J. Mertz, Membrane imaging • by second-harmonic generation microscopy. • J. Opt. Soc. Am. B, 2000. 17: p. 1685-1694.
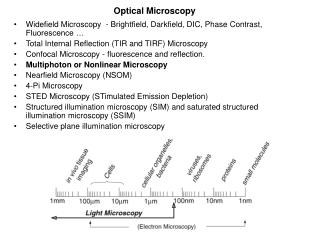
Outline: • Fluorescence Lifetime Imaging (FLIM) • 2) Fluorescence Resonance Energy Transfer (FRET) • 3) FRET/FLIM
Fluorescence Lifetime motivation • Sensitive to environment: pH, ions, potential • SNARF, Calcium Green, Cameleons • Perform in vitro calibrations • Results Not sensitive to bleaching artifacts • Not sensitive to uneven staining (unless self-quenched) • Not sensitive to alignment (intensity artifacts)
Fluorescence Quantum Yield φ: important for dyes Ratio of emitted to absorbed photons Quantum Yield: (k is rate, Inverse of time) Very fast 1-10 ps Natural lifetime Measured lifetime is sum of Rates of natural lifetime and non radiative decay paths
Oscillator strength, f, and fluorescence lifetime τ Einstein A coefficient A21=1/τ υ=light frequency, m=mass of electron, c=speed of light, e= electron charge For band centered at 500 nm, Fully allowed transition has lifetime of 4 ns (for one electron) Dyes has several valence electrons, larger f Lifetimes between 1-4 ns Fluorescent lifetime depends on environment: Used in microscopy as contrast
Unquenched and Quenched Emission Unquenched emission: Normal QY, lifetime Quenched emission Decreased QY, lifetime e.g. metals, aggregation
Gold somewhat quenches the fluorescence
2 general approaches: time domain and frequency domain Short pulse laser modulate CW laser
Frequency Domain Methods for Lifetime Measurements: Modulate laser and measure phase change of fluorescence Use cw laser (e.g. argon ion) Modulate at rate near Inverse of emission lifetime 10-100 MHz (100 to 10 ns) Measure phase change with Lockin amplifier
Modulation Methods in Frequency Domain Modulate laser OK for spectroscopy Modulate laser and ICCD (intensified CCD camera) Better S/N for imaging
ICCD Detectors for Lifetime measurements: Frequency domain and some time-domain Microchannel plates Amplify signal ~10 fold Needs to be gated rapidly Widefield imaging (no sectioning) High quantum yield Very expensive $20-80K Regular CCDs:10-20K Historically Most common
Time-domain Widefield Lifetime imaging with ICCD Variable delayed gate or many gates is scanned To sample exponential decay: Many frames (for each delay) ICCD has no time intrinsic response: slow readout gated gain. Use laser pulse width much less than fluorescence lifetime Two-photon scope has short pulse laser for time-gating
Ti:sapphire Higher viscosity Shorter lifetime Better chance for Non-radiative decay French Optics express
Time domain methods for lifetime measurements With gated electronics and fast detectors (not gain modulated) Best for point detection, PMT on laser scanning Collect data from multiple gates (windows) At the same time, fit to exponential Synchronized Gating done by pulsed laser (e.g. ti:sapphire laser)
PMT Detectors for Lifetime measurements Dispersion in time of flight across 14 dynodes Limits time response ~300 picosecond resolution Better with deconvolution Cost ~$500 Microchannel plate photomultiplier: full of holes, kick off electrons ~30 picosecond resolution No dispersion Cost ~$15000 fragile PMTS have low quantum yield (10-20%), MCP worse ~5%
Avalanche Photodiode (APD) 300-500 picosecond resolution Very small area (200 sq microns) Not good for scanning High quantum yield (up to 70% at 700 nm) Low count rate (~10 MHz) $5K Extremely fragile!!
Time gating measurements of fluorescence decay Temporal Resolution defined by IRF (laser, detector, electronics) Real IRF Ideal IRF Gate away from IRF (laser pulse, PMT response) Lose photons IRF=instrument response function, Must be (much) shorter than fluorescence lifetime (delta function) to avoid convolution Measure IRF with reflection or known short lifetime e.g. Rose Bengal (90 ps)
Practical limiting governing of the • Instrument Response Function • Laser • modern lasers: ti:sapphires 100 femtosecond • Lifetimes: nanoseconds • Not a factor • Was 20-30 years ago before modelocked lasers • 2) Detectors • APD or PMT response ~200 picoseconds: can be • MCP-PMT 30 ps: not typical limitation • 3) TCSPC or gating Electronics • 20-50 ps (depending on sophistication) • Can be convolved with MCP-PMT response
Time-correlated single photon counting: • most flexibility, most accurate, • samples whole decay • Best time response Measures time of flight of photons After excitation pulse Bins data at each time interval Rather than gating Collect enough photons to approximate exponential: Slower than gating but Better measurement, Can separate biexponentials: Multiple components
Principles of time-correlated single photon counting Been around For decades TAC or TDC measures time of flight, bins photons
Mark Terasaki Flash animation http://www.terasaki.us/flash/lab/flim01.swf
Time-Correlated Single Photon Counting electronics On laser scanning microscope (recent) TCSPC electronics synchronized with laser scanning electronics: Pixel, line, frame synch Historically very hard: mostly homebuilt (e.g. Gerritsen)
Becker & Hickel addon to Zeiss Laser scanning confocal Electronics all in one PCI board, ~50K addon
Intensity vs fluorescence lifetime image Quenched close to Nucleus due to Higher concentration Lower lifetime Same dye, different lifetime because of environment
Intensity and lifetime measurements CFP-YFP linked by short peptide chain Energy is transferred from CFP to YFP Lifetime reveals info intensity does not
TCSPC FLIM using ECFP 2 distinct lifetimes: meaning? Duncan, J. Microscopy 2004
GFP lifetime increases With increasing viscosity Limits motion, nonrad Different lifetime for B cells at immuno Junction with natural killer (NK) cell EGFP::MHC
Performance of Frequency and time domain methods TCSPC best for efficiency, S/N, information content But more expensive (ti:sapphire laser) But already have if have 2-photon microscope
Long Acquisition Times for TCSPC FLIM: Need enough data to approximate decay Dim stains 104/s Bright stains 106/s need 100-100000 Photons/pixel May bleach before done imaging Detection with 2-4 gates may be better if Short on photons
Autofluorescence of Rat Ear Contains collagen, elastin : Single exponential not sufficient for multiple components Time domain With gated ICCD Fits to two discrete components noisy (large residuals) French, 2001, Biophys J.
Continuous lifetime distribution Better for multiple components Width, h, of distribution For pixel Mean tau For pixels Unless know components Stretched exp is better Representative of physiology and provides more data
FLIM as Diagnostic of Joint Disorder Fixed, thin sections (few microns) H&E staining Widefield fluorescence Little info Widefield FLIM Detail revealed by FLIM
FLIM as Cancer Diagnostic Widefield FLIM H&E staining More contrast Than H&E Benign Probably NADH, FAD Carcinoma FLIM shows morphology like H&E histology Can optically section and no staining with FLIM With 2-p can do thick tissues (few hundred microns)
FLIM Diagnostics of arterial plaque Widefield auto fluorescence Clear lifetime Difference in Normal and plaque: Not visible by Fluorescence intensity Widefield FLIM
FLIM via endoscope as clinical tool Works like through microscope
White PNAS 2007 Lifetime of NADH, FAD changes from normal To cancer and high to low-grade
Fluorescence Resonance Energy Transfer (FRET) Donor Excitation Donor Excitation Acceptor Emission FRET Donor Emission Donor emission overlaps with Acceptor Absorption: Highly distance dependent
FRET probes conformational changes Different conformation gives Different FRET signature
Inter and Intramolecular Forms of FRET with Proteins CFP-YFP good combo FRET increases In both cases Protein-Protein Interactions In cytoplasm and membranes
When FRET Occurs No FRET for No overlap of donor emission, acceptor absorption No FRET for Orthogonal dipole orientation No FRET for molecules more than 10 nm apart R0=distance where FRET=0.5
Donor Acceptor Ro (Å) Fluorescein Tetramethylrhodamine 55 IAEDANS Fluorescein 46 EDANS DABCYL 33 Fluorescein Fluorescein 44 BODIPY FL BODIPY FL 57 Fluorescein QSY 7 dye 61 Cy3 Cy5 53 CFP YFP 50 Typical Values of Ro green red GFPs and other colored “FPs have transformed FRET microscopy Before had to label proteins, then introduce
Fluorescence Resonance Energy Transfer - Detection of Probe Proximity R0 typically 40-50 Angstroms 50% transfer
Practical Challenges to FRET Quantitation • Emission from A contaminates D channel (filters) • Emission from D contaminates A channel • Unknown labeling levels for D and A • Signal variation due to bleaching • Complicates kinetic studies • Bleaching rate of D can actually be slowed by FRET Solutions: • Separately labeled D and A controls to define bleedthrough • Acceptor destruction by photobleaching to establish • Dual wavelength ratio imaging to normalize away variations in label levels and bleaching effects
Want sharp filters, But throw away photons
Fluorescent Proteins as D-A PairsIssue of Spectral Overlap Better overlap,FRET But more bleedthrough Poor Spectral overlap, But less bleedthrough
Survey of FRET-Based Assays • Protease activity • Calcium Ion measurements • cAMP • Protein tyrosine kinase activity • Phospholipase C activity • Protein kinase C activity • Membrane potential
Principle of Operation of Chameleon Calcium Indicators FRET Increases when CaM binds Calcium ions Conformation changes, CFP-YFP closer together