Download
1 / 11
110 likes | 121 Views
A simple precise accurate TLC- densitometric method was presented for the quantitative determination of amprolium<br>hydrochloride and ethopabate in combined veterinary preparations and in presence of Levamisole hydrochloride. The compounds<br>were developed on TLC aluminum plates pre-coated with silica gel 60 F254 using methanol: water: 0.1% acetic acid (7:2.5:0.5,<br>v/v/v). The plates were air dried, detected under UV lamp and then scanned at 213 nm. The validity of the proposed method was<br>assessed using the standard addition technique. The obtained results were statistically compared with those obtained by the official<br>method, showing no significant difference with respect to accuracy and precision at p=0.05.<br>

E N D
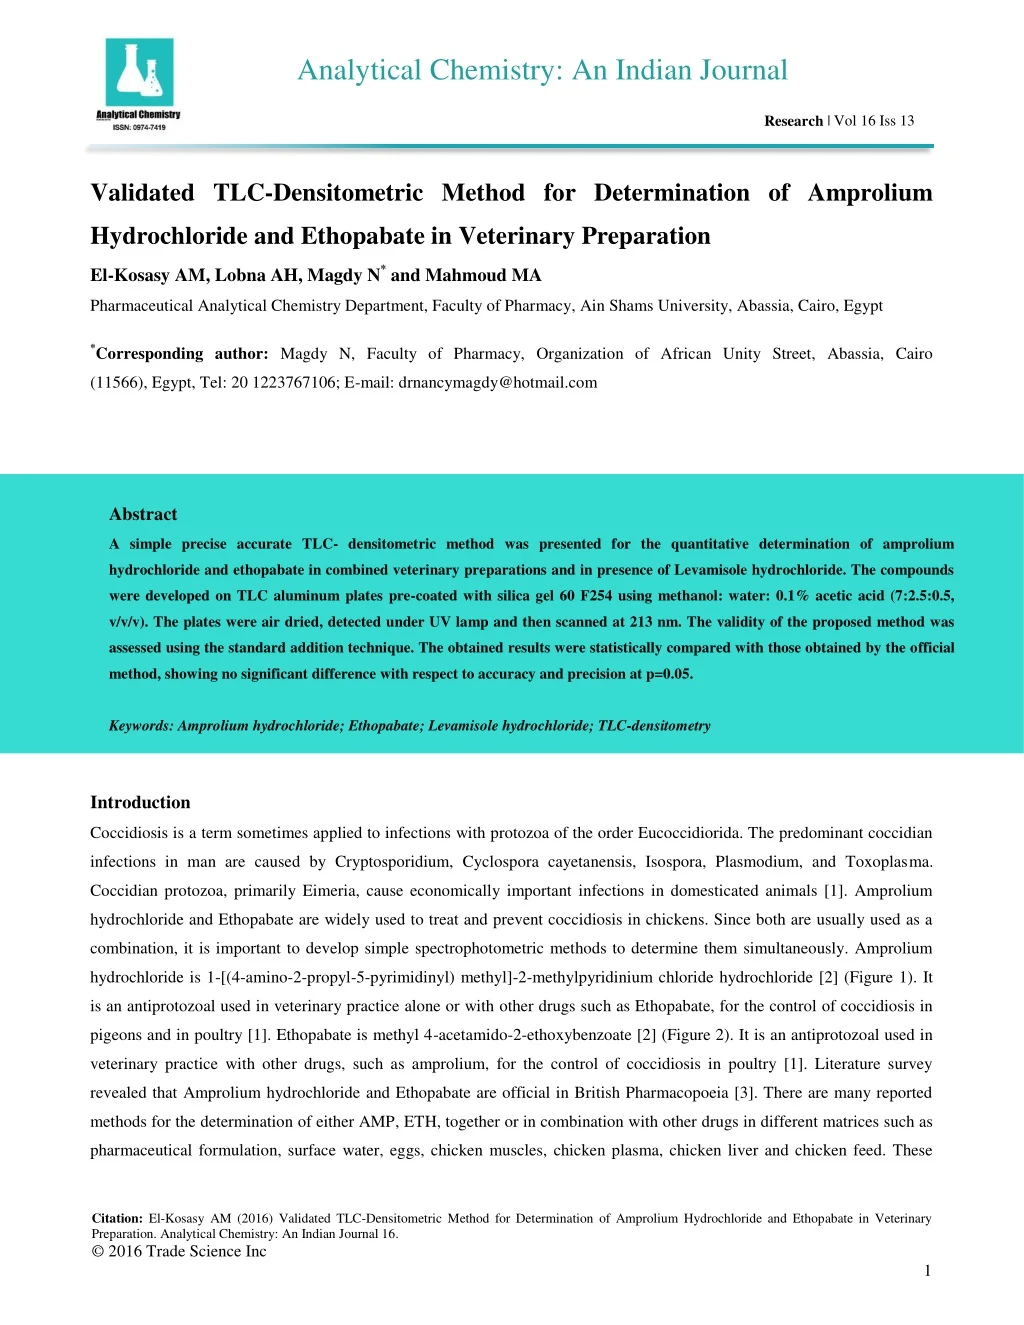
Analytical Chemistry: An Indian Journal Research | Vol 16 Iss 13 Validated TLC-Densitometric Method for Determination of Amprolium Hydrochloride and Ethopabate in Veterinary Preparation El-Kosasy AM, Lobna AH, Magdy N* and Mahmoud MA Pharmaceutical Analytical Chemistry Department, Faculty of Pharmacy, Ain Shams University, Abassia, Cairo, Egypt *Corresponding author: Magdy N, Faculty of Pharmacy, Organization of African Unity Street, Abassia, Cairo (11566), Egypt, Tel: 20 1223767106; E-mail: drnancymagdy@hotmail.com Abstract A simple precise accurate TLC- densitometric method was presented for the quantitative determination of amprolium hydrochloride and ethopabate in combined veterinary preparations and in presence of Levamisole hydrochloride. The compounds were developed on TLC aluminum plates pre-coated with silica gel 60 F254 using methanol: water: 0.1% acetic acid (7:2.5:0.5, v/v/v). The plates were air dried, detected under UV lamp and then scanned at 213 nm. The validity of the proposed method was assessed using the standard addition technique. The obtained results were statistically compared with those obtained by the official method, showing no significant difference with respect to accuracy and precision at p=0.05. Keywords: Amprolium hydrochloride; Ethopabate; Levamisole hydrochloride; TLC-densitometry Introduction Coccidiosis is a term sometimes applied to infections with protozoa of the order Eucoccidiorida. The predominant coccidian infections in man are caused by Cryptosporidium, Cyclospora cayetanensis, Isospora, Plasmodium, and Toxoplasma. Coccidian protozoa, primarily Eimeria, cause economically important infections in domesticated animals [1]. Amprolium hydrochloride and Ethopabate are widely used to treat and prevent coccidiosis in chickens. Since both are usually used as a combination, it is important to develop simple spectrophotometric methods to determine them simultaneously. Amprolium hydrochloride is 1-[(4-amino-2-propyl-5-pyrimidinyl) methyl]-2-methylpyridinium chloride hydrochloride [2] (Figure 1). It is an antiprotozoal used in veterinary practice alone or with other drugs such as Ethopabate, for the control of coccidiosis in pigeons and in poultry [1]. Ethopabate is methyl 4-acetamido-2-ethoxybenzoate [2] (Figure 2). It is an antiprotozoal used in veterinary practice with other drugs, such as amprolium, for the control of coccidiosis in poultry [1]. Literature survey revealed that Amprolium hydrochloride and Ethopabate are official in British Pharmacopoeia [3]. There are many reported methods for the determination of either AMP, ETH, together or in combination with other drugs in different matrices such as pharmaceutical formulation, surface water, eggs, chicken muscles, chicken plasma, chicken liver and chicken feed. These Citation: El-Kosasy AM (2016) Validated TLC-Densitometric Method for Determination of Amprolium Hydrochloride and Ethopabate in Veterinary Preparation. Analytical Chemistry: An Indian Journal 16. © 2016 Trade Science Inc 1
www.tsijournals.com | June-2016 methods include liquid chromatography coupled with ultraviolet (UV) [4,5] or fluorescence [6-9] detection, and liquid chromatography mass spectrometry (LC–MS) [10-16], Thin layer chromatography [4], Spectrophotometric methods [17- 21] Atomic spectrometry[22], Capillary electrophoresis [23], Electrochemical method [24]. Chickens can be infected with roundworms and coccidia. Heavy infections cause weight loss, diarrhoea and poor egg production [25]. So, it is a common practice to administer an anthelmintic with anticoccidial drugs to treat helminthiasis and coccidiosis. Levamisole hydrochloride (Figure 3) (LEV) is widely used as an anthelmintic in cattle, sheep, goats, swine, and poultry. It is effective against gastrointestinal nematodes [26]. Figure 1: Structure of amprolium hydrochloride. Figure 2: Structure of Ethopabate. Figure 3: Structure of Levamisole hydrochloride. The literature survey revealed that no methods have been reported for the analysis of AMP and ETH in combination with the co-administered drug LEV. The aim of the present work is to develop a new, simple, accurate and precise TLC- densitometric method validated according to ICH guidelines. Experimental Instrumentation Desaga densitometer model CD 60 (Germany) AS 30 Desaga applicator Desaga UV lamp with short wavelength (254 nm) TLC aluminium plates pre-coated with silica gel 60 F254 (E. Merck). Chromatographic tank 20 x 21 x 9 cm Chemicals and reagents Amprolium hydrochloride and Ethopabate are kindly supplied by Prima Vet pharmaceutical company, Cairo, Egypt. Their purity is found to be 100.35% and 99.5%, respectively, according to the reported spectrophotometric method [26]. Levamisole hydrochloride (LEV) kindly supplied by Amoun pharmaceutical company, Obour city, Qhalubeya, Egypt. Its purity was certified to be 100.20%. 2
www.tsijournals.com | June-2016 All chemicals and solvents used were of analytical grade: Methanol (Riedel-de Haën, Sigma-Aldrich, Germany) Bi-distilled water and is indicated by “water”. Glacial acetic acid (E. Merck, Darmastadt, Germany) was used to prepare 0.1% acetic acid Standard solutions A stock solution of AMP was prepared by dissolving 0.1 gm of AMP in 100 mL methanol. A stock solution of ETH was prepared by dissolving 0.1 gm of ETH in 100 mL methanol. Similarly, a stock solution of LEV was prepared by dissolving 0.1 gm of LEV in 100 mL methanol. Procedure Chromatographic conditions: Analysis was performed on 20 × 20 cm TLC aluminum plates pre-coated with silica gel 60 F254 (E.Merck). Spots were applied 1 cm apart from each other and 2 cm apart from the bottom edge. The chromatographic tank was pre-saturated with the developing system for 30 min at room temperature. The plates were developed by ascending chromatography for 8 cm, using methanol: water: 0.1% acetic acid (7:2.5:0.5, v/v/v) as a developing system. The plates were air dried, detected under UV lamp and then scanned at 213 nm under the following experimental conditions of measurement: Photo mode: Reflectance. Scan mode: Linear slit scanning. Slit width=0.4 mm. Slit height=0.02 mm. Result output: Densitogram and peak list. Method validation Linearity: Different aliquots equivalent to (0.4 - 10 μg/spot) of AMP, (0.4 - 19 μg/spot) of ETH and (0.4 - 10 μg/spot) of LEV were applied to the TLC plates, in triplicates, the chromatographic conditions were adjusted, the plates were developed and scanned at 213 nm. Peak areas were measured and calibration curves relating the peak areas and their corresponding concentrations for each drug were constructed and the regression equations were then computed. Accuracy: The previously mentioned procedure under linearity was repeated for determination of different concentrations of pure samples of AMP, ETH and LEV in triplicates. The concentrations were calculated from the corresponding regression equations and the mean recovery percentages and standard deviations were then calculated. Precision: The intraday and interday variations were evaluated by applying the previously mentioned procedure, for analysis of 5, 7 and 9 µg/spot of AMP, 5, 12 and 14 µg/spot of ETH and 1, 3 and 5 µg/spot of LEV each three times (n=9) on the same day and on three successive days, respectively. The concentrations were calculated from the corresponding regression equation, the recovery percentages and standard deviations were then calculated. Specificity: The specificity of the method was established through studying the resolution (Rs) for each drug from the nearest resolving peak, also the selectivity factor (α) was studied. 3
www.tsijournals.com | June-2016 Limit of detection (LOD) and limit of quantification (LOQ): LOD and LOQ were calculated using the corresponding calibration curve. According to the ICH guidelines for determination of LOD and LOQ, the estimation was based on the standard deviation of response. LOD=3.3 x σ / S LOQ=10 x σ / S Where, σ is the standard deviation of response and S is the slope of the calibration curve. Here, the standard deviation of the y-intercept of the regression line can be used as the standard deviation of response. Application of the proposed method for the determination of AMP and ETH in pharmaceutical formulation (Amprolium & Ethopabate premix 25%®): For determination of AMP, 0.1 gm of the premix equivalent to 25 mg of AMP was accurately weighed, sonicated in 25 mL methanol for 15 min and filtered into 100- mL volumetric flask. The residue was washed three times each with 5 mL methanol and then completed to volume with methanol. For determination of ETH, 1 gm of the premix equivalent to 16 mg of ETH was accurately weighed, sonicated in 25 mL methanol for 15 min and filtered into 100- mL volumetric flask. The residue was washed three times each with 5 mL methanol and then completed to volume with methanol. The previously mentioned procedure under linearity was repeated and the concentrations of AMP and ETH were calculated from the corresponding regression equations and the mean recovery percentages and standard deviations were then calculated. Standard addition technique was applied by analyzing the pharmaceutical formulation spiked with different concentrations of pure standard drug. These concentrations of AMP and ETH were calculated from the corresponding regression equations and the mean recovery percentages and standard deviations were then calculated. Results and Discussion TLC-densitometric technique was proposed for simultaneous determination of AMP and ETH in presence of LEV, an anthelmintic commonly co-administered with anticoccidial drugs to treat helminthiasis and coccidiosis in chickens. The technique was based on the difference in Rf values of AMP, ETH and LEV. Mixtures of AMP, ETH and LEV were spotted separately at equivalent locations on TLC plates. The plates were developed in the traditional linear ascending manner for 8 cm, where the best resolution was obtained. The plates were air dried and the separated drugs` spots were determined densitometrically on the plates at 213 nm. Experimental conditions such as developing system and wavelength of detection were optimized to provide accurate, precise and reproducible results. Different developing systems were tried such as methanol: water (7: 1, v/v). With this developing system, the spots of AMP and LEV remained at the baseline due to their hydrophilic nature as both are hydrochloride salts. Thus, the polarity of this system was increased by adding more water and different volumes of 0.1% acetic acid. The best resolution of the three drugs was achieved by using methanol: water: 0.1% acetic acid (7:2.5:0.5, v/v/v). The Rf values were 0.1, 0.34 and 0.83 for AMP, LEV and ETH, respectively. (Figure 4) 4
www.tsijournals.com | June-2016 Figure 4: TLC Densitogram showing excellent separation of AMP (Rf=0.1), LEV (Rf=0.34) and ETH (Rf=0.83). The calibration curves in TLC are generally inherently non-linear due to scattering of light. They generally comprise a pseudo-linear region at low sample concentrations and then departure from linearity begins at higher sample concentrations [27]. With TLC, the analyte interacts with the layer surface of the stationary phase where scattering and absorption tend to take place specially with high concentrations of analyte [28]. These combined processes are not adequately described by Beer-Lambert`s law, but the Kubelka Munk model [29]. Moreover, the ICH guidelinesmentioned that for some analytical procedures which do not demonstrate linearity, the analytical response should be described by an appropriate function of the concentration of the sample. The relationship between the integrated peak area and the concentration was evaluated with linear and polynomial regression functions. Fitting with linear function gave correlation coefficients (r) values of 0.9993, 0.9916 and 0.9972 for AMP, ETH and LEV, respectively. While, fitting with 2nd order polynomial function gave better (r) value of 0.9996 for each of AMP, ETH and LEV and lower standard deviation values and was therefore used for quantitative analysis. Calibration curve for AMP, ETH and LEV were constructed in the range of 0.4 –10 μg/spot, 0.4 –19 μg/spot and 0.4 – 10 μg/spot, respectively. The polynomial regression equations were computed and found to be: A=-5.0940C2 + 554.6252C + 0.7296, r=0.9996 for AMP, A=-3.6401C2 + 195.0667C + 126.3503, r=0.9996 for ETH and A= -12.7586C2 + 573.2461C - 45.237, r=0.9996 for LEV, Where, A is the peak area, C is the concentration in μg/spot and r is the correlation coefficient. The proposed method was successfully applied for the determination of AMP, ETH and LEV in bulk powder with mean recovery percentages of 100.72 ± 1.189, 99.93 ± 1.258and 100.53 ± 0.654, respectively (Table 1). 5
www.tsijournals.com | June-2016 AMP ETH LEV Taken Found % Recovery Taken Found % Recovery Taken Found % Recovery (μg/spot) (μg/spot) (μg/spot) (μg/spot) (μg/spot) (μg/spot) 0.9 0.900 100.00 0.4 0.391 97.75 0.9 0.905 100.56 3 3.084 102.80 5 5.046 100.92 1 0.998 99.80 5 5.001 100.02 6 6.035 100.58 3 3.047 101.57 7 7.011 100.16 12 12.010 100.08 5 5.011 100.22 9 9.057 100.63 14 14.045 100.32 7 7.034 100.49 100.72 ± 99.93 ± 100.53 ± Mean ± S.D. Mean ± S.D. Mean ± S.D. 1.189 1.258 0.654 R.S.D% R.S.D% R.S.D% 1.181 1.259 0.651 * Average of three determinations Table 1: Results of accuracy for the determination of pure samples of AMP, ETH and LEV by the proposed TLC- densitometric method. The specificity of the proposed method was illustrated in figure 63 where complete separation of the three drugs was shown. Consequently the results of system suitability tests assured that AMP, ETH and the commonly co-administered anthelmintic LEV can be determined simultaneously without interference from each other (Table 2). Parameter AMP ETH LEV Reference value Retention factor (Rf) 0.1 0.83 0.34 - Selectivity factor (α) 4.64 9.7 4.64 α >1 Rs >1 Resolution (Rs) 2.5 4.74 2.5 Table 2: System suitability test results of the proposed TLC-densitometric method for the determination of AMP, ETH and LEV. The proposed method was successfully applied for determination of AMP and ETH in their combined pharmaceutical formulation and its validity was assessed by applying the standard addition technique (Table 3). The results of analysis of the pharmaceutical formulation and the standard addition technique suggested that there was no interference from any excipients. 6
www.tsijournals.com | June-2016 Dosage form Drug TLC-densitometric method Found Found Taken % recovery* Added % recovery* Amprolium & (µg/spot) (µg/spot) (µg/spot) (µg/spot) Ethopabate premix 25%® 2.5 2.526 101.04 4 3.996 99.90 AMP (250 gm AMP 5 5.057 101.14 and 16 gm 6 6.018 100.30 ETH/ Kg) Mean ± S.D. 100.45 ± 0.633 1.6 1.637 102.31 4 3.998 99.95 ETH 5 5.002 100.04 6 5.995 99.92 Mean ± S.D. 99.97 ± 0.062 *average of three determinations Table 3: Determination of Amprolium hydrochloride and Ethopabate in their pharmaceutical formulation by the proposed TLC-densitometric method and application of standard addition technique. Statistical comparison showed that there was no significant difference between the results obtained from the proposed method and those obtained from the reported method. The proposed method was found to be accurate and precise since the t and F values were less than the tabulated ones (Table 4). Reported methodb Value TLC-densitometric method AMP ETH AMP ETH Mean 100.72 99.93 100.35 99.50 SD 1.189 1.258 1.560 1.543 RSD% 1.181 1.259 1.555 1.551 N 5 5 6 6 Variance 1.414 1.583 2.434 2.381 Student`s t-testa F valuea 0.437 0.497 _ _ (2.262) (2.262) 1.720 1.504 _ _ (6.256) (6.256) a The values in parenthesis are the corresponding theoretical values of t and F at (P=0.05) b First derivative spectrophotometry at 288.8 and 320.6 nm for AMP and ETH, respectively 7
www.tsijournals.com | June-2016 Table 4: Statistical comparison of the results obtained by applying the proposed TLC-densitometric method and the reported method for the analysis of pure Amprolium hydrochloride and Ethopabate. Validation of the proposed method for the simultaneous determination of AMP, ETH and LEV was made by measuring concentration range, linearity, accuracy, specificity, precision and limits of detection and quantification, according to ICH guidelines(Table 5). Parameters TLC-densitometric method AMP ETH LEV λ (nm) 213 213 213 Concentration range 0.4 – 10 0.4 – 19 0.4 – 10 (µg/spot) Linearity Slope 554.6252 195.0667 573.2461 0.7296 126.3503 -45.2376 Intercept 0.9996 0.9996 0.9996 Correlation coefficient (r) 100.72 ± 1.189 100.53 ± 0.654 Accuracy 99.93 ± 1.258 (mean ± S.D.) Specificity specific specific specific Precision (%RSD) Repeatabilitya 0.297 0.958 0.739 Intermediate precisionb 0.227 1.122 0.678 LODc (µg/spot) LOQc (µg/spot) 0.061 0.038 0.075 0.184 0.116 0.228 a The intraday (n=3), average of three different concentrations repeated three times within day. b The interday (n=3), average of three different concentrations repeated three times in three successive days. c Limit of detection and limit of quantification Table 5: Assay parameters and method validation for the determination of pure samples of AMP, ETH and LEV by the proposed TLC-densitometric method. 8
www.tsijournals.com | June-2016 The proposed method show better sensitivity, better LOD and LOQ values than a reported TLC method [4] (Table 6). Besides, our accuracy, specificity and precision values are within acceptable ranges. Proposed TLC densitometric method Reported TLC densitometric method Parameters AMP ETH AMP ETH Concentration range 0.4 – 10 0.4 – 19 2-25 1-10 (µg/spot) 100.72 ± 1.189 Accuracy 99.93 ± 1.258 99.80 ± 1.058 99.37 ± 0.954 (mean ± S.D.) Precision (%RSD) Repeatability 0.297 0.958 0.780 0.88 Intermediate precision 0.227 1.122 1.030 0.11 LOD (µg/spot) 0.061 0.038 0.4 0.05 LOQ (µg/spot) 0.184 0.116 1.32 0.15 Table 6: Comparison of the results obtained by the proposed TLC densitometric method and the reported TLC method. Conclusion The proposed method was simple, rapid, sensitive, accurate and capable of full resolution of the two anticoccidial drugs amprolium hydrochloride and ethopabate in presence of the commonly co-administered anthelmintic drug levamisole hydrochloride. Also, the proposed method was suitable for routine quality control analysis of amprolium hydrochloride and ethopabate in their pharmaceutical formulation. References 1. S.C. Sweetman, Royal Pharmaceutical Society, Martindale: The Complete Drug Reference, thirty-sixth ed., Vol. 1, Pharmaceutical Press, London, 2009. 2. Maryadele J. O’Neil, The Merck index: An Encyclopedia of Chemicals, Drugs and Biologicals, fourteenth ed., Merck & Co. Inc,, Whitehouse Station, NJ, USA, 2006. 3. British pharmacopoeia Commission, British pharmacopoeia (Volume: veterinary), Stationery Office, London, 2013. 4. Salama NN (2012) Int J Pharm Biomed Res 3: 185-190. 5.Tan HS, Ramachandran P, Cacini W (1996) High performance liquid chromatographic assay of amprolium and ethopabate in chicken feed using solid-phase extraction. J Pharm Biomed Anal 15: 259-265. 9
www.tsijournals.com | June-2016 6.Hamamoto K1, Koike R, Shirakura A, Sasaki N, Machida Y (1997) Rapid and sensitive determination of amprolium in chicken plasma by high-performance liquid chromatography with post-column reaction. J Chromatogr B Biomed Sci Appl 693: 489-492. 7. Hormazabal V, Yndestad M (1996) Rapid assay for the determination of residues of amprolium and ethopabate in chicken meat by HPLC J. Liq. Chrom. Rel. Technol. 19: 2517–2525. 8. Nagata T, Saeki M (1986) Liquid chromatographic determination of amprolium in chicken tissues, using post-column reaction and fluorometric detection. J Assoc Off Anal Chem 69: 941-943. 9. Nagata T, Saeki M, Nakazawa H, Fujita M, Takabatake E (1985) Sensitive determination of ethopabate residues in chicken tissues by liquid chromatography with fluorometric detection. J Assoc Off Anal Chem 68: 27-28. 10. Moloney M1, Clarke L, O'Mahony J, Gadaj A, O'Kennedy R, et al. (2012) Determination of 20 coccidiostats in egg and avian muscle tissue using ultra high performance liquid chromatography-tandem mass spectrometry. J Chromatogr A 1253: 94-104. 11. Martínez-Villalba A1, Moyano E, Galceran MT (2010) Analysis of amprolium by hydrophilic interaction liquid chromatography-tandem mass spectrometry. J Chromatogr A 1217: 5802-5807. 12. Chiaochan C1, Koesukwiwat U, Yudthavorasit S, Leepipatpiboon N (2010) Efficient hydrophilic interaction liquid chromatography-tandem mass spectrometry for the multiclass analysis of veterinary drugs in chicken muscle. Anal Chim Acta 682: 117-129. 13. Squadrone S1, Mauro C, Ferro GL, Amato G, Abete MC (2008) Determination of amprolium in feed by a liquid chromatography-mass spectrometry method. J Pharm Biomed Anal 48: 1457-1461. 14. Song W1, Huang M, Rumbeiha W, Li H (2007) Determination of amprolium, carbadox, monensin, and tylosin in surface water by liquid chromatography/tandem mass spectrometry. Rapid Commun Mass Spectrom 21: 1944-1950. 15. Hormazabal V (2002) Determination of amprolium, ethopabate, lasalocid, monensin, narasin, and salinomycin in feed by liquid chromatography-mass spectrometry. J. Liq. Chrom. Rel. Technol 25: 2655–2663. 16. Hormazabal V, Yndestad M (2000) Determination of amprolium, ethopabate, lasalocid, monensin, narasin, and salinomycin in chicken tissues, plasma, and egg using liquid chromatography-massJ. Liq. Chrom. Rel. Technol 23: 1585– 1598. 17. Hassouna MEM, El-Succary SAA (2004) Egypt J Chem 47: 143-156. 18. Fink DW1, deFontenay G, Bonnefille P, Camarade M, Monier C (2004) Further studies on the spectrophotometric determination of amprolium. J AOAC Int 87: 677-680. 19. Attia FMA (2002) Determination of amineptine and amprolium hydrochlorides through ion associates with cobalt (II) thiocyanate. Sci. Pharm 70: 379-390. 20. El-Sherif ZA (2000) Simple UV Zero-Order and Derivative Spectrophotometric Analysis of Ampprolium Hydrochloride and Ethopabate in Veterinary Premixes J Drug Res 17: 23. 21. Adel FS, Mahmoud SR, Yousry MI, Ehab MAtia (1997) Extraction-spectrophotometric determination of amprolium hydrochloride using bromocresol green, bromophenol blue and bromothymol blue. Mikrochim. Acta 127: 269-272. 22. El-Hawary WF (2002) Determination of lignocaine and amprolium in pharmaceutical formulations using AAS. J Pharm Biomed Anal 27: 97-105. 23. Martínez-Villalba A, Núñez O, Moyano E, Galceran MT (2013) Field amplified sample injection-capillary zone electrophoresis for the analysis of amprolium in eggs. Electrophoresis 34: 870-876. 10
www.tsijournals.com | June-2016 24. Yousry MI, Mahmoud SR, Adel FS, Ehab MA (1998) Plastic membrane electrodes for amprolium. Mikrochim. Acta 129: 195-200. 25. http://www.fao.org/docrep/t0690e/t0690e08.htm#unit 55: internal parasites of chickens and ducks 26. El-Kholy H, Kemppainen BW (2005) Levamisole residues in chicken tissues and eggs. Poult Sci 84: 9-13. 27. Poole CF, Poole SK (1989) Progress in densitometry for quantitation in planar chromatography. J Chromatogr 492: 539- 584. 28. McCarthy KE, Wang Q, Tsai EW, Gilbert RE, Ip DP, et al. (1998) Determination of losartan and its degradates in COZAAR tablets by reversed-phase high-performance thin-layer chromatography. See comment in PubMed Commons below J Pharm Biomed Anal 17: 671-677. 29. Fried B, Sherma J (1994) Thin layer chromatography, Techniques and Applications, 3rd Ed., Marcel Dekker, New York. 11