Download
1 / 10
100 likes | 102 Views
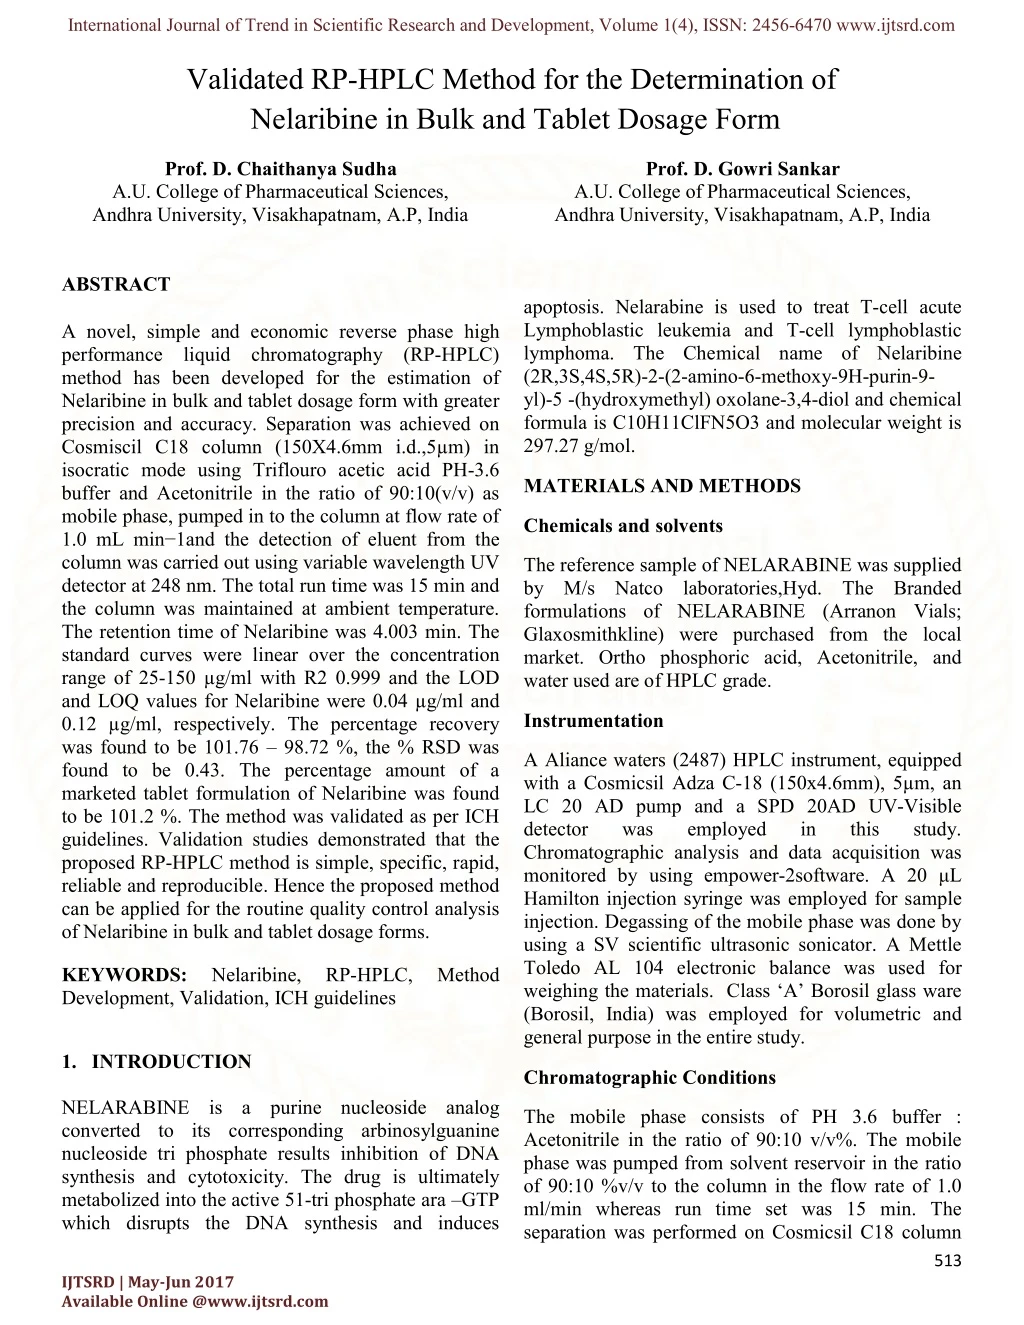
A novel, simple and economic reverse phase high performance liquid chromatography (RP-HPLC) method has been developed for the estimation of Nelaribine in bulk and tablet dosage form with greater precision and accuracy. Separation was achieved on Cosmiscil C18 column (150X4.6mm i.d.,5-u00b5m) in isocratic mode using Triflouro acetic acid PH-3.6 buffer and Acetonitrile in the ratio of 90:10(v/v) as mobile phase, pumped in to the column at flow rate of 1.0 mL min-1and the detection of eluent from the column was carried out using variable wavelength UV detector at 248 nm. The total run time was 15 min and the column was maintained at ambient temperature. The retention time of Nelaribine was 4.003 min. The standard curves were linear over the concentration range of 25-150 -u00b5g/ml with R2 0.999 and the LOD and LOQ values for Nelaribine were 0.04 -u00b5g/ml and 0.12 -u00b5g/ml , respectively. The percentage recovery was found to be 101.76 'u201c 98.72 %, the % RSD was found to be 0.43. The percentage amount of a marketed tablet formulation of Nelaribine was found to be 101.2 %. The method was validated as per ICH guidelines. Validation studies demonstrated that the proposed RP-HPLC method is simple, specific, rapid, reliable and reproducible. Hence the proposed method can be applied for the routine quality control analysis of Nelaribine in bulk and tablet dosage forms. Mrs.P.D.Chaithanya Sudha | Prof.D.Gowri Sankar"Validated RP-HPLC Method for the Determination of Nelaribine in Bulk and Tablet Dosage Form" Published in International Journal of Trend in Scientific Research and Development (ijtsrd), ISSN: 2456-6470, Volume-1 | Issue-4 , June 2017, URL: http://www.ijtsrd.com/papers/ijtsrd181.pdf http://www.ijtsrd.com/pharmacy/analytical-chemistry/181/validated-rp-hplc-method-for-the-determination-of-nelaribine-in-bulk-and-tablet-dosage-form/mrspdchaithanya-sudha<br>

E N D
International Journal of Trend in Scientific Research and Development, Volume 1(4), ISSN: 2456-6470 www.ijtsrd.com Validated RP-HPLC Method for the Determination of Nelaribine in Bulk and Tablet Dosage Form Prof. D. Chaithanya Sudha A.U. College of Pharmaceutical Sciences, Andhra University, Visakhapatnam, A.P, India Prof. D. Gowri Sankar A.U. College of Pharmaceutical Sciences, Andhra University, Visakhapatnam, A.P, India ABSTRACT A novel, simple and economic reverse phase high performance liquid chromatography (RP-HPLC) method has been developed for the estimation of Nelaribine in bulk and tablet dosage form with greater precision and accuracy. Separation was achieved on Cosmiscil C18 column (150X4.6mm i.d.,5µm) in isocratic mode using Triflouro acetic acid PH-3.6 buffer and Acetonitrile in the ratio of 90:10(v/v) as mobile phase, pumped in to the column at flow rate of 1.0 mL min−1and the detection of eluent from the column was carried out using variable wavelength UV detector at 248 nm. The total run time was 15 min and the column was maintained at ambient temperature. The retention time of Nelaribine was 4.003 min. The standard curves were linear over the concentration range of 25-150 µg/ml with R2 0.999 and the LOD and LOQ values for Nelaribine were 0.04 µg/ml and 0.12 µg/ml, respectively. The percentage recovery was found to be 101.76 – 98.72 %, the % RSD was found to be 0.43. The percentage amount of a marketed tablet formulation of Nelaribine was found to be 101.2 %. The method was validated as per ICH guidelines. Validation studies demonstrated that the proposed RP-HPLC method is simple, specific, rapid, reliable and reproducible. Hence the proposed method can be applied for the routine quality control analysis of Nelaribine in bulk and tablet dosage forms. apoptosis. Nelarabine is used to treat T-cell acute Lymphoblastic leukemia and T-cell lymphoblastic lymphoma. The Chemical name of Nelaribine (2R,3S,4S,5R)-2-(2-amino-6-methoxy-9H-purin-9- yl)-5 -(hydroxymethyl) oxolane-3,4-diol and chemical formula is C10H11ClFN5O3 and molecular weight is 297.27 g/mol. MATERIALS AND METHODS Chemicals and solvents The reference sample of NELARABINE was supplied by M/s Natco laboratories,Hyd. The Branded formulations of NELARABINE (Arranon Vials; Glaxosmithkline) were purchased from the local market. Ortho phosphoric acid, Acetonitrile, and water used are of HPLC grade. Instrumentation A Aliance waters (2487) HPLC instrument, equipped with a Cosmicsil Adza C-18 (150x4.6mm), 5µm, an LC 20 AD pump and a SPD 20AD UV-Visible detector was employed Chromatographic analysis and data acquisition was monitored by using empower-2software. A 20 μL Hamilton injection syringe was employed for sample injection. Degassing of the mobile phase was done by using a SV scientific ultrasonic sonicator. A Mettle Toledo AL 104 electronic balance was used for weighing the materials. Class ‘A’ Borosil glass ware (Borosil, India) was employed for volumetric and general purpose in the entire study. in this study. KEYWORDS: Development, Validation, ICH guidelines Nelaribine, RP-HPLC, Method 1.INTRODUCTION NELARABINE is a purine nucleoside analog converted to its corresponding arbinosylguanine nucleoside tri phosphate results inhibition of DNA synthesis and cytotoxicity. The drug is ultimately metabolized into the active 51-tri phosphate ara –GTP which disrupts the DNA synthesis and induces Chromatographic Conditions The mobile phase consists of PH 3.6 buffer : Acetonitrile in the ratio of 90:10 v/v%. The mobile phase was pumped from solvent reservoir in the ratio of 90:10 %v/v to the column in the flow rate of 1.0 ml/min whereas run time set was 15 min. The separation was performed on Cosmicsil C18 column 513 IJTSRD | May-Jun 2017 Available Online @www.ijtsrd.com
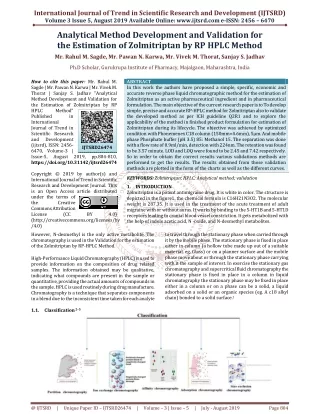
International Journal of Trend in Scientific Research and Development, Volume 1(4), ISSN: 2456-6470 www.ijtsrd.com and the column was maintained the temperature of 25°C and the volume of each injection was 10 μL. Prior to injection, the column was equilibrated for at least 30 min with mobile phase flowing through the system. The eluents were monitored at 248 nm. of Nelaribine and then diluted up to mark with diluent. Such that the final concentrations were in the range 25-150 ppm of Nelaribine. Volume of 10μl of each sample was injected in five times for each concentration level and calibration curve was constructed by plotting the peak area versus drug concentration. A linear relationship between peakarea vs. concentration was observed in the range of study. The observations and calibration curve were shown in figure.2. Preparation of buffer solution: (PH: 3.6): 1ml of Trifloroacetic acid solution in a 1000ml of volumetric flask add about 100ml of milli-Q water and final volume make up to 1000 ml with milli-Q water and degas to sonicate and finally make up the volume with water then added 1ml of Triethylamine then pH adjusted to 3.6with dil. Trifloroacetic acid solution. Linearity and Construction of calibration curve The quantitative determination of the drug was accomplished by the external standard method. The mobile phase was filtered through a 0.45μ membrane filter before use. The flow rate of the mobile phase was adjusted to 1.0 mL/min. The column was equilibrated with the mobile phase for at least 30 min prior to the injection of the drug solution. The column temperature is maintained at 25±10 C throughout the study. Linearity of the peak area response was determined by taking six replicate measurements at seven concentration points. Working dilutions of NELARABINE in the range of 25-150 μg/mL were prepared by taking suitable dilutions of the standard solutions in different 10 mL volumetric flasks and diluted up to the mark with the mobile phase. Twenty microlitres of the dilutions was injected each time into the column at flow rate of 1.0 mL/min. Each dilution was injected six times into the column. The drug in the eluents was monitored at 248 nm and the corresponding chromatograms were obtained. From the chromatograms, the mean peak areas were noted and a plot of concentrations over the peak areas was constructed. The regression of the plot was computed by least squares method. The linear relationship was found to be in the range of 25-150 μg / mL between the concentration of NELARABINE and peak area response. This regression equation was later used to estimate the amount pharmaceutical dosage forms. The linearity plot was shown in the Fig.2 and the linearity data and the statistical parameters for the linearity plot are reported in Table 3 & 4. Preparation of mobile phase: Buffer and Acetonitrile are in the ratio 90:10 %v/v, filtered through 0.45 μ filter under vacuum. Preparation of standard solution: (100µg/ml): Accurately Weigh and transfer accurately 31.25 mg of Nelarabine working Standard into a 50 ml clean dry volumetric flask, and add about 30 ml of diluents, dissolve and dilute to volume with diluents. Transfer 2.0 ml above solution into 200 ml volumetric flask and dilute to volume with diluent( Milli-Q water as diluent). Preparation of sample solution: Accurately pipette out 2.0 ml of sample solution in to 200 mL volumetric flask without any loss of solution. Add 120 ml 0f diluent, shake well to dissolve and dilute to volume with diluents and mix well. From the filtered solution 1ml was pipette out into a 10 ml volumetric flask and made up to 10ml with diluent. Label Claim: 37.5 mg of Nelaribine Validation of Proposed method: of NELARABINE in The developed method was validated as per the ICH (International Conference guidelines with respect to System suitability, Precision, Specificity, Forced degradation studies, Linearity, Accuracy, Limit of detection and Limit of quantification. on Harmonization) VALIDATION OF THE PROPOSED METHOD: The method was validated in compliance with ICH guidelines. The following determined for validation. Linearity parameters were Aliquots of 0.25, 0.5, 0.75, 1.0, 1.25 and 1.5 ml were taken from stock solution of concentration 100 µg/ml 514 IJTSRD | May-Jun 2017 Available Online @www.ijtsrd.com
International Journal of Trend in Scientific Research and Development, Volume 1(4), ISSN: 2456-6470 www.ijtsrd.com Specificity Robustness The method specificity was assessed by comparing the chromatograms obtained from the drug with the most commonly used excipient mixture with those obtained from the blank solution. The blank solution was prepared by mixing the excipients in the mobile phase without the drug. The drug to excipient ratio used was similar to that in the commercial formulations. The commonly used excipients in formulations like lactose, starch, microcrystalline cellulose, ethyl cellulose, methylcellulose, magnesium stearate and colloidal silicon dioxide were used for the study. The mixtures were filtered through 0.45μ membrane filter before injection. An observation of the chromatograms indicates absence of excipient peaks near the drug peak in the study runtime. This indicates that the method is specific. A study was conducted to determine the effect of deliberate variations chromatographic conditions like composition of the mobile phase, flow rate, and mobile phase pH. The effect of these changes on the system suitability parameters like tailing factor and number of theoretical plates and on assay was studied. A single condition was varied at a time keeping all other parameters constant. The results were found to be within the allowed limits which indicate that the method is specific. in the optimized hydroxyl propyl Variations in flow rate of the mobile phase: Demonstrated robustness of method by changing the flow rate for 0.9 ml/min and 1.1 ml/min instead of specified flow rate (1.0 ml/min). By injecting the replicate injections of standard in 0.9 ml/min and 1.1 ml/min flow rate and found that system suitability parameters were passed. The %RSD of peak area, tailing factor and theoretical plates of Nelarabine standard was found within the limits. Precision Precision is the degree of repeatability of an analytical method under normal operational conditions. The precision of the method was studied in terms of repeatability (intra-day assay) and intermediate precision (inter-day assay). Method repeatability was studied by repeating the assay three times in the same day for intra-day precision and intermediate precision was studied by repeating the assay on three different days, three times on each day (inter-day precision). The intra-day and inter-day determination of NELARABINE was carried out at three different concentration levels 25, 50, 75 μg/mL level. The coefficient of variation values as presented in the Table.5 shows that the method provides acceptable (<2) intraday and inter-day variation. Variations in the pH of the mobile phase: The effect of variation in the pH of the mobile phase was evaluated at ± 0.2 levels. The system suitability results were found to be within the limits as shown in the following table- variation for Variations in the temperature of column: Robustness of the method by changing the column temperature for 28°C and 31°C instead of specified column temperature (30°C) are shown. By injecting the replicate injections of standard in 28°C column and 31°C column temperature and found that system suitability parameters were passed. The %RSD of peak area, tailing factor and theoretical plates of Nelarabine standard was found within the limits. Accuracy Accuracy of the method was evaluated by standard addition method. An amount of the pure drug at three different concentration levels in its solution has been added to the pre analysed working standard solution of the drug. The sample solutions were analysed in triplicate at each level as per the proposed method. The percent individual recovery and %RSD for recovery at each level are calculated. The results are tabulated (Table.6). A recovery ranged from 98.72 – 102 % has been obtained by the method indicates its accuracy. Limit of Detection and Limit of Quantification Limit of detection (LOD) is defined as the lowest concentration of analyte that gives a measurable response. LOD is determined based on signal to noise ratio (S/N) of three times typically for HPLC methods. The limit of quantification (LOQ) is defined as the lowest concentration that can be quantified reliably with a specified level of accuracy and precision. It is the lowest concentration at which the 515 IJTSRD | May-Jun 2017 Available Online @www.ijtsrd.com
International Journal of Trend in Scientific Research and Development, Volume 1(4), ISSN: 2456-6470 www.ijtsrd.com precision expressed by a RSD of less than 2%. In this study the analyte response is 10 times greater than the noise response. For this study six replicates of the analyte at lowest concentration in the calibration range were measured and quantified. CONCLUSION The present study was aimed at developing a sensitive, precise and accurate HPLC method for the analysis of NELARABINE in bulk drug and in pharmaceutical dosage forms. using C18 column, flow rate was 1.0ml/min, Trifluoroacetic acid buffer solution pH 3.6 ±0.05 and solvent mixture (Acetonitrile) in (90:10 v/v). Detection wave length was 248nm.The instrument used was WATERS HPLC auto sampler. The retention times were found to be 4.003 mins. The analytical method was validated according to ICH guidelines (ICH Q2b). The correlation coefficient (r2) was found to be 0.998, % recovery was 101.76- 98.72% and %RSD for precision on replicate injection was 0.43 and intermediate precision for intraday precision at condition- I, II and III was 0.7, 0.2 and 0.3 interday precision at condition-I,II and III was 1.2,0.3 and 0.3 respectively. The precision study was precise, robust, and repeatable. LOD value was 0.0405 and LOQ value was 0.1229. Average Baseline Noise obtained from Blank = 98.1936 µV mobile Phase: Signal Obtained from LOD solution = 7985 µV LOD = 3.3×σ/s = 3.3×98.1936/7985 = 0.0405 LOQ = 10×σ/s = 10×98.1936/7985 = 0.1229 System precision and System suitability System precision and system suitability studies were carried out by injecting six replicates of the working standard solution. The % RSD for the peak areas obtained was calculated. The data presented in Table 2.3.9 (% RSD<1) establishes performance of the instrument. The system suitability parameters are given in Table 2.3.10. The deliberate changes in the method have not much affected the peak tailing, theoretical plates and the percent assay. This indicates that the present method is robust. The lowest values of LOD and LOQ as obtained by the proposed method indicate the method is sensitive. The standard solution of the drug was stable up to 24 hours as the difference in percent assay is within limit. reproducible Assay calculation: System suitability parameters were studied with six replicates standard solution of the drug and the calculated parameters are within the acceptance criteria. %Assay = ?? ?? ???× ? ??×??? ???×??? ? ??× ?× ?.? Where, TA = peak area response due to Nelarabine from sample SA = peak area response due to Nelarabine from standard The tailing factor, the number theoretical plates and HETP are in the acceptable limits. Hence the author concludes that the proposed HPLC method is sensitive and reproducible for the analysis of NELARABINE in pharmaceutical dosage forms with short analysis time. SW = Weight of Nelarabine working standard taken in mg P = purity of Nelarabine working standard taken on as is basis REFERENCES 1)Nelarabineinjection drug profile and pharmaco kinetic information, from website http://www.drug information.com/RxDrugs/N/Nelarabine Injection.htm accessedon 2)Jeanette Kaiser, PharmD, Professor Irene Krämer, “Physico-chemical stability of nelarabine infusion L.A = Labeled amount of Nelarabine in mg %Assay 862111/845634x31.25x2/25x200/2x99.2/100x100/5 = 08/01/2013. = 100.192% 516 IJTSRD | May-Jun 2017 Available Online @www.ijtsrd.com
International Journal of Trend in Scientific Research and Development, Volume 1(4), ISSN: 2456-6470 www.ijtsrd.com 13)Michael E, Schartz IS, Krull. Analytical method development and Validation, 3rd ed. John Wiley & sons, London,( 2004),P. 25-46. 14)Douglas A Skoog, Donald M west , James Holler F, Fundamentals of analytical chemistry 7th edition, (2004), Vol; 1(13),P. 628-641. 15)Frank A settle, hand book of instrumental techniques for analytical chemistry, Pearson edition, (2004), P.147-159. 16)PD Sethi. High chromatography,1sted, Distributers, New Delhi, ( 2001),P.1-30. 17)David G. Watson, Pharmaceutical Analysis, 1st edition, Churchill Publishers limited, (1999). 18)Beckett A.H and J.B. Stenlake, Practical Pharmaceutical Chemistry, CBS Publishers and Distributers; volume II, (1997), P. 157-160. 19)Chasten LG. Pharmaceutical Chemistry. Vol. II. New York: Marcel Dekker Inc; 1996, P. 23-25. 20)International conference Guidelines on validation of Analytical Procedures Definitions and Terminology Federal Register, (1995). 21)Lough WJ, Wainer IW. High Performance Liquid Chromatography: fundamental practice. Glasgow (UK): Blackie Academic & Professional, (1995), P. 2-28. 22)Asian Guideline for Validation of Analytical Procedure Adopted from ICH guideline, Q2A27 (1994) and ICH Q2B, (1994). 23)David CL, Michael Webb. Pharmaceutical Analysis. London: Black well publishing, (1994), P.2-4. 24)ICH, Stability testing of new drug substances and products. Geneva: International Conference on Harmonization. IFPMA,2003. 25)Mallikarjunarao B, Arpita C, Srinivasu MK, Lalithadevi M, Rajender kumar P, Chandrasekhar KB, Srinivasan AK, Prasad AS and Ramanatham J, A stability indicating HPLC assay method for docetaxel. J Pharm and BiomedAnal. 2006; 41: 676-681. 26)Stokvis E, Rosing H, Beijen JH. Liquid chromatography-mass quantitative analysis of anticancer drugs. Mass Spectrom Rev2005;24:887-917. solutions in EVA infusion bags”, European Journal Hospital Pharma Science, 2011, Vol; 17(1), P.7-12. 3)Suresh Kumar GV, Development and Validation of Reversed-Phase HPLC Method for Simultaneous Estimation of Rosuvastatin and Fenofibrate in Tablet Dosage Form, International Journal of Pharm Techniques Research, (2010),Vol ;2(3),P.206-202. 4)Jan Styczynski, Beata Kolodziej, Beata Rafinska, Differential activity of nelarabine a clofarabine in leukaemia and lymphoma cell lines, Wspolczesna Onkologia, (2009) Vol; 13(6),P.281–286. 5)Wang Juan, Zhang Rong, ZHAO Yan-yan, Lu Lai-Chun, High-performance chromatography Clofarabine Clofarabine Injection content ,(2009),Vol;18,P. 8-24. 6)Peter L. Bonateet al, The distribution, metabolism, and elimination of Clofarabine in rats, J Oncol Pharm Pract, ( 2005),Vol; 33( 6), P.739-748. 7)Kurtzberg J, Ernst TJ, Keating MJ, Gandhi V, Hodge JP, Kisor DF, Lager JJ, Stephens C, Levin J, Krenitsky T, Elion G, Mitchell BS. Phase I administered on a consecutive 5-day schedule in children and adults with refractory hematologic malignancies. Journal of Clinical Oncology (2005), Vol; 23(15),P.3396-3403. 8)Berg SL, Blaney SM, Devidas M, Lampkin TA, Murgo A, Bernstein M, Billett A, Kurtzberg J, Reaman G, Gaynon P, Whitlock J, Krailo M, Harris MB, Phase II study of nelarabine in children and young adults with refractory T-cell malignancies, Journal of Clinical Oncology (2005) ,Vol ;23(15), P.3376-3382. 9)Parker WB, Secrist JA 3rd, Waud WR, Purine nucleoside antimetabolites in development for the treatment of cancer. Current Investigational Drugs (2004), Vol; 5(6), P.592- 596. 10)B.k Sharma, instrumental methods of chemical analysis, introduction to analytical chemistry, 19th ed, goel publishing house , meerut, (2004), P.286- 385. 11)Gurdeep R. Chatwal, Sharma K and Anand, Instrumental Method of Chemical analysis, 5th Edition, Himalaya publication, New Delhi ,(2008),P.561-567. 12)International Conference on Harmonization (ICH) Harmonised Tripartite Guideline, Validation of Analytical Procedures,Text and Methodology, (2005) , Q2 (R1). Rajendraprasad Y, performance CBS liquid Publishers & Livingstone, Harcourt liquid of Harmonization principles & Opinion in spectrometry for the 517 IJTSRD | May-Jun 2017 Available Online @www.ijtsrd.com
International Journal of Trend in Scientific Research and Development, Volume 1( International Journal of Trend in Scientific Research and Development, Volume 1(4), ISSN: 2456 2456-6470 www.ijtsrd.com Figures: Chemical Structure: Figure.1 y = 16454x + 31764 R² = 0.997 R² = 0.997 y = 16454x + 31764 3000000 2500000 2000000 peak area 1500000 1000000 500000 0 0 20 40 60 80 100 120 140 160 concentration Fig.2 Linearity Plot for the proposed method Linearity Plot for the proposed method Table 1 Optimized Chromatographic conditions and system suitability parameters for proposed HPLC Optimized Chromatographic conditions and system suitability parameters for proposed HPLC method for Nelaribine Parameter Chromatographic conditions Optimized Chromatographic conditions and system suitability parameters for proposed HPLC Parameter Chromatographic conditions S.No Parameter Parameter Value Cosmicsil Adza C-18 (150x4.6mm), 5µm 1 Column Column Trifluoro acetic acid pH-3.6 buffer and Acetonitrile in the ratio of 90:10 v/v 3.6 2 Mobile phase Mobile phase buffer and Acetonitrile in the 3 Flow rate Flow rate 1mL/min 4 Run time Run time 15.0 min 5 25±10 C Column temperature Column temperature 518 IJTSRD | May-Jun 2017 Available Online @www.ijtsrd.com
International Journal of Trend in Scientific Research and Development, Volume 1(4), ISSN: 2456-6470 www.ijtsrd.com 6 Volume of injection 10 µL 7 Detection wave length 248nm 8 Retention time of the drug 4.003 min Table.2 Accuracy Conc. Of Nelarabine in ppm Nelarabine peakArea S.NO 25 442399 1 50 862111 2 75 130223 3 100 1630614 4 125 2045323 5 150 2512346 6 Table.3 Calibration of the proposed HPLC Method Concentration of NELARABINE (μg/mL) Peak Area 25 442399 862111 50 1302223 75 1630614 100 2045323 125 2546233 150 Table.4Regression characteristics of the linearity plot of NELARABINE Value Parameter Linearity Range (μg) 25-150 Slope (a) 16264 Intercept (b) 30585 519 IJTSRD | May-Jun 2017 Available Online @www.ijtsrd.com
International Journal of Trend in Scientific Research and Development, Volume 1(4), ISSN: 2456-6470 www.ijtsrd.com Correlation coefficient 0.998 Regression Equation Y = 16264X + 30585 Table.5. Precision of the proposed method Concentration of NELARABINE (µg/mL) Intra-day Precision Inter-day Precision Mean SD % RSD Mean amount found (n=9) 448172 SD % RSD 445202 3132.96 0.7% 8624.2 1.2% 25 860569 1947.16 0.2% 858664 2784.8 0.3% 50 1356106 4428.01 0.3% 1304275 4832.2 0.3% 75 Table.6 Accuracy data (Triplicate values at different concentration levels) Spike Level Conc µg/m Conc µg/ml Amount found % Mean % Recovery Recovery Amount added (pure) Amount added (formulation) 10 10 10 10 10 8 8 8 10 10 7.864 7.872 7.863 10.022 10.030 101.84 101.72 101.73 99.64 99.77 80% 101.76 100% 99.35 10 12 12 10 10 10 10.024 12.156 12.147 99.72 98.65 98.81 120% 98.72 12 10 12.176 98.70 520 IJTSRD | May-Jun 2017 Available Online @www.ijtsrd.com
International Journal of Trend in Scientific Research and Development, Volume 1(4), ISSN: 2456-6470 www.ijtsrd.com Table.7 Variations in the flow rate Peak area Average % RSD 864511 867732 867865 865567 867783 867899 866702 0.2% 0.9ml/min 867083 0.1% 1.1ml/min Table.8 Variations in the PH Peak area Average % RSD 865577 867883 868894 866221 867783 867889 867451 0.1% 3.4 867297 0.1% 3.8 Table.9 Variations in the temperature Peak area Average % RSD 588678 588772 588892 867745 866785 867998 280c 588780 0.018% 310c 867509 0.07% Table.10 System precision Injection No. Peak area 1 845634 2 857096 3 866190 4 853829 5 850789 6 859723 521 IJTSRD | May-Jun 2017 Available Online @www.ijtsrd.com
International Journal of Trend in Scientific Research and Development, Volume 1(4), ISSN: 2456-6470 www.ijtsrd.com Mean 855543 SD 7138.6 % RSD 0.8% Table.11 System suitability parameters Parameters Values 4890 Theoretical plates (n) 7509 Plates per meter (N) 1.08 Tailing factor (T) 0.0405 LOD 0.1229 LOQ 522 IJTSRD | May-Jun 2017 Available Online @www.ijtsrd.com