Download
1 / 1
10 likes | 88 Views
T he Key to Capturing Attention: Eye Tracking Analysis of Display Advertising, Public Relations & Retailing Holly Manciero, Patricia Huddleston 1 , Bridget Behe 2 , Stella Minahan 3 , Lynne Sage 4. Research Questions

E N D
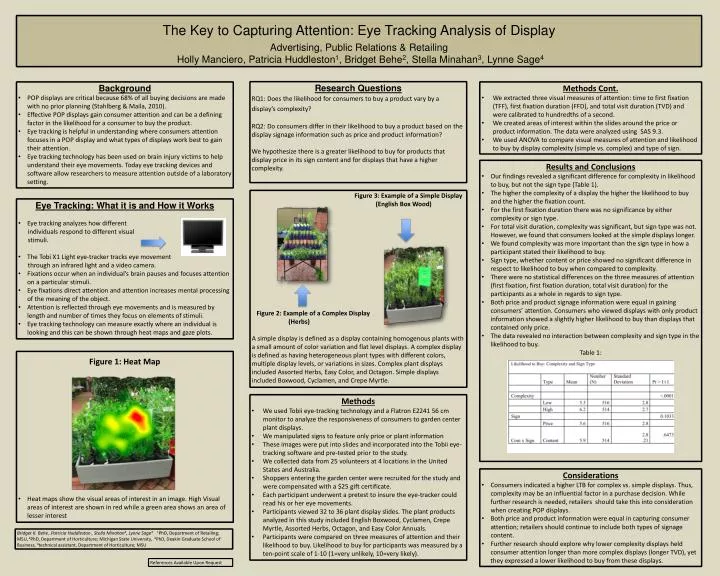
The Key to Capturing Attention: Eye Tracking Analysis of Display Advertising, Public Relations & Retailing Holly Manciero, Patricia Huddleston1, Bridget Behe2, Stella Minahan3, Lynne Sage4 Research Questions RQ1: Does the likelihood for consumers to buy a product vary by a display’s complexity? RQ2: Do consumers differ in their likelihood to buy a product based on the display signage information such as price and product information? We hypothesize there is a greater likelihood to buy for products that display price in its sign content and for displays that have a higher complexity. • Background • POP displays are critical because 68% of all buying decisions are made with no prior planning (Stahlberg & Maila, 2010). • Effective POP displays gain consumer attention and can be a defining factor in the likelihood for a consumer to buy the product. • Eye tracking is helpful in understanding where consumers attention focuses in a POP display and what types of displays work best to gain their attention. • Eye tracking technology has been used on brain injury victims to help understand their eye movements. Today eye tracking devices and software allow researchers to measure attention outside of a laboratory setting. • Methods Cont. • We extracted three visual measures of attention: time to first fixation (TFF), first fixation duration (FFD), and total visit duration (TVD) and werecalibrated to hundredths of a second. • We created areas of interest within the slides around the price or product information. The data were analyzed using SAS 9.3. • We used ANOVA to compare visual measures of attention and likelihood to buy by display complexity (simple vs. complex) and type of sign. • Results and Conclusions • Our findings revealed a significant difference for complexity in likelihood to buy, but not the sign type (Table 1). • The higher the complexity of a display the higher the likelihood to buyand the higher the fixation count. • For the first fixation duration there was no significance by either complexity or sign type. • For total visit duration, complexity was significant, but sign type was not. However, we found that consumers looked at the simple displays longer. • We found complexity was more important than the sign type in how a participant stated their likelihood to buy. • Sign type, whether content or price showed no significant difference in respect to likelihood to buy when compared to complexity. • There were no statistical differences on the three measures of attention (first fixation, first fixation duration, total visit duration) for the participants as a whole in regards to sign type. • Both price and product signage information were equal in gaining consumers’ attention. Consumers who viewed displays with only product information showed a slightly higher likelihood to buy than displays that contained only price. • The data revealed no interaction between complexity and sign type in the likelihood to buy. • Table 1: Figure 3: Example of a Simple Display (English Box Wood) Figure 2: Example of a Complex Display (Herbs) A simple display is defined as a display containing homogenous plants with a small amount of color variation and flat level displays. A complex display is defined as having heterogeneous plant types with different colors, multiple display levels, or variations in sizes. Complex plant displays included Assorted Herbs, Easy Color, and Octagon. Simple displays included Boxwood, Cyclamen, and Crepe Myrtle. • Eye Tracking: What it is and How it Works • Eye tracking analyzes how different • individuals respond to different visual • stimuli. • The Tobi X1 Light eye-tracker tracks eye movement • through an infrared light and a video camera. • Fixations occur when an individual’s brain pauses and focuses attention on a particular stimuli. • Eye fixations direct attention and attention increases mental processing of the meaning of the object. • Attention is reflected through eye movementsand is measured by length and number of times they focus on elements of stimuli. • Eye tracking technology can measure exactly where an individual is looking and this can be shown through heat maps and gaze plots. • Figure 1: Heat Map • Heat maps show the visual areas of interest in an image. High Visual areas of interest are shown in red while a green area shows an area of lesser interest • Methods • We used Tobiieye-tracking technology and a Flatron E2241 56 cm monitor to analyze the responsiveness of consumers to garden center plant displays. • We manipulated signs to feature only price or plant information • These images were put into slides and incorporated into the Tobii eye-tracking software and pre-tested prior to the study. • We collected data from 25 volunteers at 4 locations in the United States and Australia. • Shoppers entering the garden center were recruited for the study and were compensated with a $25 gift certificate. • Each participant underwent a pretest to insure the eye-tracker could read his or her eye movements. • Participants viewed 32 to 36 plant display slides. The plant products analyzed in this study included English Boxwood, Cyclamen, Crepe Myrtle, Assorted Herbs, Octagon, and Easy Color Annuals. • Participants were compared on three measures of attention and their likelihood to buy. Likelihood to buy for participants was measured by a ten-point scale of 1-10 (1=very unlikely, 10=very likely). • Considerations • Consumers indicated a higher LTB for complex vs. simple displays. Thus, complexity may be an influential factor in a purchase decision. While further research is needed, retailers should take this into consideration when creating POP displays. • Both price and product information were equal in capturing consumer attention; retailers should continue to include both types of signage content. • Further research should explore why lower complexity displays held consumer attention longer than more complex displays (longer TVD), yet they expressed a lower likelihood to buy from these displays. Bridget K. Behe, Patricia Huddleston , Stella Minahan3, Lynne Sage41PhD, Department of Retailing; MSU, 2PhD, Department of Horticulture; Michigan State University, 3PhD, Deakin Graduate School of Business, 4technical assistant, Department of Horticulture; MSU References Available Upon Request