Download
1 / 52
520 likes | 672 Views
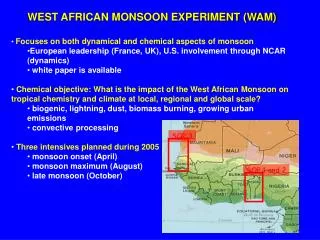
West African Monsoon Region of Analysis. Total West African Monsoon Region of analysis: 15 o W – 10 o E, 5 o N – 20 o N Sub-Sahel Region of analysis: 15 o W – 10 o E, 7.5 o N – 15 o N

E N D
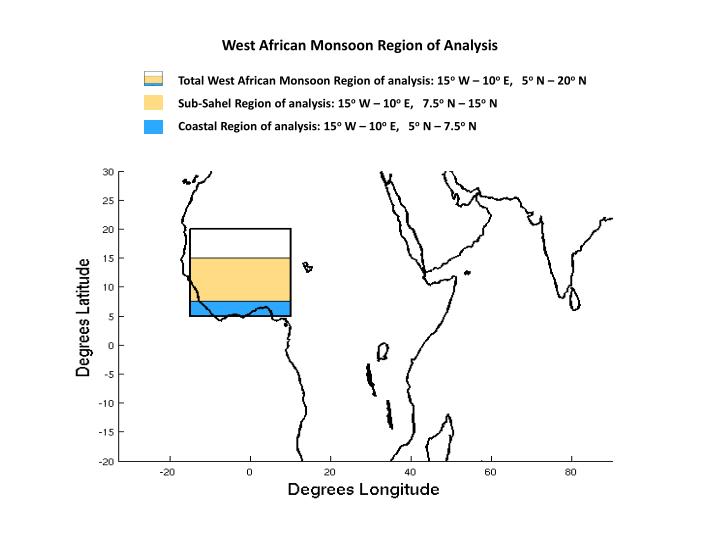
West African Monsoon Region of Analysis Total West African Monsoon Region of analysis: 15o W – 10o E, 5o N – 20o N Sub-Sahel Region of analysis: 15o W – 10o E, 7.5o N – 15o N Coastal Region of analysis: 15o W – 10o E, 5o N – 7.5o N
Precipitation Patterns Sub-Sahel Coastal Precipitation intensity (mm/day), averaged over 15o W – 10o E (WAM)
Inter-annual Precipitation trmm data merra
era-interim gpcp Precipitation intensity (mm/day), averaged monthly over : 15o W – 10o E, and 5o N – 20o N (WAM) 15o W – 10o E, and 7.5o N – 15o N (Sahel Area) 15o W – 10o E, and 5o N – 7.5o N (Coastal Area)
Inter-annual Precipitation merra trmm data era-interim Precipitation intensity (mm/day), averaged monthly over 15o W – 10o E, and 5o N – 20o N (WAM), for the years 1999 – 2005. Precipitation intensity (mm/day), averaged over summer months, over 15o W – 10o E, and 5o N – 20o N (WAM), for the years 1999 – 2005.
Inter-annual Precipitation Trends merra trmm data era-interim May June
gpcp test
July August
September May-June
July-September May-September Precipitation intensity (mm/day), averaged yearly over : 15o W – 10o E, and 5o N – 20o N (WAM) 15o W – 10o E, and 7.5o N – 15o N (Sub-Sahel Area) 15o W – 10o E, and 5o N – 7.5o N (Coastal Area) for the years 1998 – 2007 for trmm, 1999 – 2005 for merra and era-interim, and 1997 – 2007 for gpcp.
TRMM Regional Precipitation 1999 (maximum rainfall) 2005 (minimum rainfall) Difference (1999-2005) Spring: Summer: Spring (April-May-June) and summer (July-August-September) precipitation (and their difference) averaged over the WAM
TRMM Regional Precipitation 1999 2000 2001 2002 Spring: Summer: Spring (April-May-June) and summer (July-August-September) precipitation averaged over the WAM
TRMM Regional Precipitation 2003 2004 2005 Spring: Summer: Spring (April-May-June) and summer (July-August-September) precipitation averaged over the WAM
Merra Precipitation & Associated Winds 1999 (maximum rainfall) 2000 (minimum rainfall) Difference (1999 – 2000) Spring: Summer: Spring (April-May-June) and summer (July-August-September) precipitation and winds at 925 hPa and 700 hPa, (and their difference) averaged over the WAM
Era-Interim Precipitation & Associated Winds 1999 (maximum rainfall) 2002 (minimum rainfall) Difference (1999 – 2002) Spring: Summer: Spring (April-May-June) and summer (July-August-September) precipitation and winds at 925 hPa and 700 hPa, (and their difference) averaged over the WAM
Inter-annual Relative Humidity merra era-interim Vertically averaged relative humidity, averaged monthly over 15o W – 10o E, and 5o N – 20o N (WAM), for the years 1999 – 2005. Vertically averaged relative humidity, averaged over summer months, over 15o W – 10o E, and 5o N – 20o N (WAM), for the years 1999 – 2005.
Merra Relative Humidity & Associated Winds 1999 (maximum precipitation) 2000 (minimum precipitation) Difference (1999 – 2000) Spring: Summer: Spring (April-May-June) and summer (July-August-September) vertically averaged relative humidity and winds at 925 hPa and 700 hPa (and their difference), averaged over the WAM
Era-Interim Relative Humidity & Associated Winds 1999 (maximum precipitation) 2002 (minimum precipitation) Difference (1999 – 2002) Spring: Summer: Spring (April-May-June) and summer (July-August-September) vertically averaged relative humidity and winds at 925 hPa and 700 hPa (and their difference), averaged over the WAM
1999 (maximum precipitation) 2000 (minimum precipitation) Difference (1999 – 2000) Merra Relative Humidity & Meridional-Vertical Circulation Meridional-vertical circulation and relative humidity in summer (July-August-September) (and their difference), all averaged over 15o W – 10o E. Merra Relative Humidity & Longitudinal-Vertical Circulation Longitudinal-vertical circulation and relative humidity in summer (July-August-September) (and their difference), all averaged over 5o N – 20o N.
Merra Relative Humidity & Associated Meridional-Vertical Circulation1999 2000 2001 2002 Meridional-vertical circulation and relative humidity in summer (July-August-September), all averaged over 15o W – 10o E. Merra Relative Humidity & Associated Longitudinal-Vertical Circulation1999 2000 2001 2002 Longitudinal-vertical circulation and relative humidity in summer (July-August-September), all averaged over 5o N – 20o N.
Merra Relative Humidity & Associated Meridional-Vertical Circulation2003 2004 2005 Meridional-vertical circulation and relative humidity in summer (July-August-September), all averaged over 15o W – 10o E. Merra Relative Humidity & Associated Longitudinal-Vertical Circulation2003 2004 2005 Longitudinal-vertical circulation and relative humidity in summer (July-August-September), all averaged over 5o N – 20o N.
1999 (maximum precipitation) 2002 (minimum precipitation) Difference (1999 – 2002) Era-Interim Relative Humidity & Meridional-Vertical Circulation Meridional-vertical circulation and relative humidity in summer (July-August-September) (and their difference), all averaged over 15o W – 10o E. Era-Interim Relative Humidity & Longitudinal-Vertical Circulation Longitudinal-vertical circulation and relative humidity in summer (July-August-September) (and their difference), all averaged over 5o N – 20o N.
Era-Interim Relative Humidity & Associated Meridional-Vertical Circulation1999 2000 2001 2002 Meridional-vertical circulation and relative humidity in summer (July-August-September), all averaged over 15o W – 10o E. Era-Interim Relative Humidity & Associated Longitudinal-Vertical Circulation1999 2000 2001 2002 Longitudinal-vertical circulation and relative humidity in summer (July-August-September), all averaged over 5o N – 20o N, for 1000 hPa – 700 hPa
Era-Interim Relative Humidity & Associated Meridional-Vertical Circulation2003 2004 2005 Meridional-vertical circulation and relative humidity in summer (July-August-September), all averaged over 15o W – 10o E. Era-Interim Relative Humidity & Associated Longitudinal-Vertical Circulation2003 2004 2005 Longitudinal-vertical circulation and relative humidity in summer (July-August-September), all averaged over 5o N – 20o N, for 1000 hPa – 700 hPa
Merra Seasonal Cycle of Moisture Flux1999 (maximum rainfall) 2000 (minimum rainfall) Difference (1999 – 2000) Seasonal cycle of moisture flux (s-1) across 50 N (averaged over -150 W – 100 E), plotted as [v(dq/dy)] in row one, [q(dv/dy)] in row two, and [v(dq/dy) + q(dv/dy)] in row three.
Merra Seasonal Cycle of Moisture Flux1999 (maximum rainfall) 2000 (minimum rainfall) Difference (1999 – 2000) WAM: Sub-Sahel: Coastline: Seasonal cycle of moisture flux (s-1) (averaged over -150 W – 100 E), across the entire WAM in row one, Across the Sub-Sahel Area in row two, and across the Coastal Area in row three.
Merra Seasonal Cycle of Moisture Flux1999 (maximum rainfall) 2000 (minimum rainfall) Difference (1999 – 2000) Seasonal cycle of moisture flux (s-1) across 50 N (averaged over -150 W – 100 E), plotted as v in row 1 and as q in row two.
Merra Seasonal Cycle of Moisture Flux1999 (maximum rainfall) 2000 (minimum rainfall) Difference (1999 – 2000) Seasonal cycle of moisture flux (s-1) across 50 N (averaged over -150 W – 100 E), plotted as dv/dy in row 1 and as dq/dy in row two.
Merra Seasonal Cycle of Moisture Flux 1999 2000 2001 2002 Seasonal cycle of moisture flux (s-1) across 50 N (averaged over -150 W – 100 E), plotted as [v(dq/dy)] in row one, [q(dv/dy)] in row two, and [v(dq/dy) + q(dv/dy)] in row three.
Merra Seasonal Cycle of Moisture Flux 2003 2004 2005 Seasonal cycle of moisture flux (s-1) across 50 N (averaged over -150 W – 100 E), plotted as [v(dq/dy)] in row one, [q(dv/dy)] in row two, and [v(dq/dy) + q(dv/dy)] in row three.
Merra Seasonal Cycle of Moisture Convergence (g kg-1 day-1), averaged over the West African Monsoon Domain Comparison of total moisture convergence cycles, and its components related to nonlatent and latent heating, respectively Era-Interim Seasonal Cycle of Moisture Convergence (g kg-1 day-1), averaged over the West African Monsoon Domain plots in progress
Merra Seasonal Cycle of Moisture Convergence (g kg-1 day-1), averaged over the West African Monsoon Domain Merra Seasonal Cycle of Moisture Convergence (g kg-1 day-1), averaged over the West African Monsoon Domain non-latent heat adjusted for precipitation: Comparison of total moisture convergence cycles, and its components related to nonlatent and latent heating, respectively
Merra Seasonal Cycle of Moisture Convergence (g kg-1 day-1),) averaged over the WAM for 1999 and 2000 Merra Seasonal Cycle of Moisture Convergence (g kg-1 day-1), averaged over the WAM for 1999 and 2000 non-latent heat adjusted for precipitation: Comparison of 1999 (maximum precipitation) and 2000 (minimum precipitation) total moisture convergence cycles, and its components related to nonlatent and latent heating, respectively
Merra Seasonal Cycle of Moisture Convergence1999 (maximum rainfall) 2000 (minimum rainfall) Difference (1999 – 2000) Seasonal cycle of moisture convergence (g kg-1 day-1) averaged over 1000 hPa – 700 hPa in the WAM by total, nonlatent heat-divergent, and latent heat-divergent winds (and the difference). The contours represent associated precipitation values (mm/day).
Merra Seasonal Cycle of Moisture Convergence1999 2000 2001 2002 Seasonal cycle of moisture convergence (g kg-1 day-1) averaged over 1000 hPa – 700 hPa in the WAM by total, nonlatent heat-divergent, and latent heat-divergent winds. The contours represent associated precipitation values (mm/day).
Merra Seasonal Cycle of Moisture Convergence2003 2004 2005 Seasonal cycle of moisture convergence (g kg-1 day-1) averaged over 1000 hPa – 700 hPa in the WAM by total, nonlatent heat-divergent, and latent heat-divergent winds. The contours represent associated precipitation values (mm/day).
Era-Interim Seasonal Cycle of Moisture Convergence1999 (maximum rainfall) 2002 (minimum rainfall) Difference (1999 – 2000) Seasonal cycle of moisture convergence (g kg-1 day-1) averaged over 1000 hPa – 700 hPa in the WAM by total, nonlatent heat-divergent, and latent heat-divergent winds (and the difference). The contours represent associated precipitation values (mm/day).
Era-Interim Seasonal Cycle of Moisture Convergence1999 (maximum rainfall) 2000 2001 2002 (minimum rainfall) 2003 2004 2005 Seasonal cycle of moisture convergence (g kg-1 day-1) averaged over 1000 hPa – 700 hPa in the WAM by total, nonlatent heat-divergent, and latent heat-divergent winds (and the difference). The contours represent associated precipitation values (mm/day).
Merra Meridional-Vertical Circulation1999 (maximum precipitation) 2000 (minimum precipitation) (1999-2000) Meridional-vertical circulation, its divergent and non-divergent components, and their moisture convergence in summer (July-August-September), all averaged over 15o W – 10o E. Column 3 represents the difference between 1999 and 2000 values (the years of maximum and minimum precipitation, respectively). The solid line marks the coast line.
Merra Meridional-Vertical Circulation1999 (maximum precipitation) 2000 (minimum precipitation) (1999-2000) As above, for pressure levels 1000 hPa – 700 hPa
MerraMeridional-Vertical Circulation 1999 (maximum precipitation) 2000 (minimum precipitation) (1999-2000) Divergent meridional-vertical circulation, its nonlatent and latent heating components, and their moisture convergence in summer (July-August-September), all averaged over 15o W – 10o E. Column 3 represents the difference between 1999 and 2000 values (the years of maximum and minimum precipitation, respectively). The solid line marks the coast line.
MerraMeridional-Vertical Circulation1999 (maximum precipitation) 2000 (minimum precipitation) (1999-2000) As above, for pressure levels 700 hPa – 1000 hPa
Merra Longitudinal-Vertical Circulation1999 (maximum precipitation) 2000 (minimum precipitation) (1999 – 2000) Longitudinal-veritcal circulation, its divergent and non-divergent components, and their moisture convergence in summer (July-August-September), all averaged over 15o W – 10o E. Column three represents the difference between 1999 and 2000 values (the years of maximum and minimum precipitation, respectively).
Merra Longitudinal-Vertical Circulation1999 (maximum precipitation) 2000 (minimum precipitation) (1999 – 2000) As above, for pressure levels 700 hPa – 1000 hPa
Merra Longitudinal-Vertical Circulation 1999 (maximum precipitation) 2000 (minimum precipitation) (1999 – 2000) Divergent longitudinal-vertical circulation, its nonlatent and latent heating components, and their moisture convergence in summer (July-August-September), all averaged over 15o W – 10o E. Column three represents the difference between 1999 and 2000 values (the years of maximum and minimum precipitation, respectively).
Merra Longitudinal-Vertical Circulation1999 (maximum precipitation) 2000 (minimum precipitation) (1999 – 2000) As above, for pressure levels 700 hPa – 1000 hPa