Download
1 / 1
10 likes | 239 Views
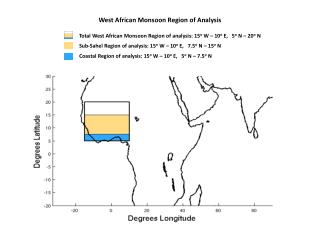
Sensitivity of the West African Monsoon to Gulf of Guinea SSTs. Kerry H. Cook and Edward K. Vizy, Cornell University. Introduction

E N D
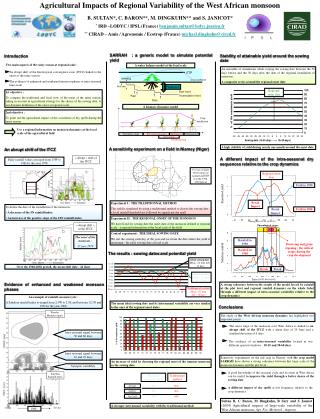
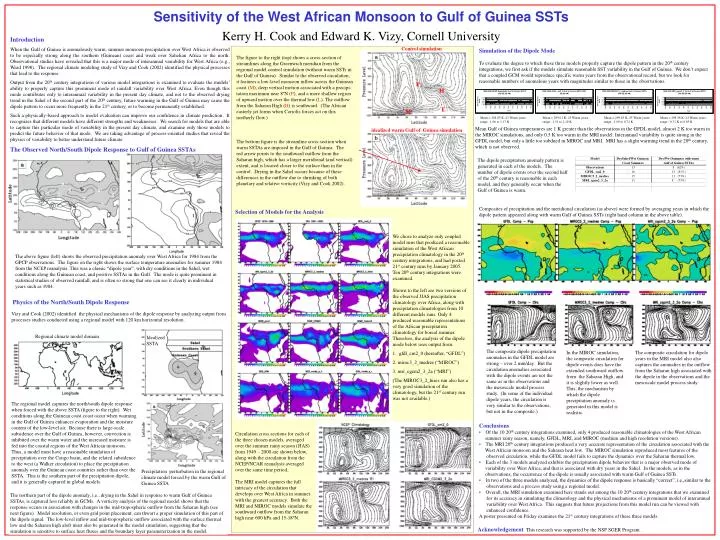
Sensitivity of the West African Monsoon to Gulf of Guinea SSTs Kerry H. Cook and Edward K. Vizy, Cornell University Introduction When the Gulf of Guinea is anomalously warm, summer monsoon precipitation over West Africa is observed to be especially strong along the southern (Guinean) coast and weak over Sahelian Africa to the north. Observational studies have revealed that this is a major mode of interannual variability for West Africa (e.g., Ward 1998). The regional climate modeling study of Vizy and Cook (2002) identified the physical processes that lead to the response. Output from the 20th century integrations of various model integrations is examined to evaluate the models’ ability to properly capture this prominent mode of rainfall variability over West Africa. Even though this mode contributes only to interannual variability in the present day climate, and not to the observed drying trend in the Sahel of the second part of the 20th century, future warming in the Gulf of Guinea may cause the dipole pattern to occur more frequently in the 21st century, or to become permanently established. Such a physically-based approach to model evaluation can improve our confidence in climate prediction. It recognizes that different models have different strengths and weaknesses. We search for models that are able to capture this particular mode of variability in the present day climate, and examine only those models to predict the future behavior of that mode. We are taking advantage of process-oriented studies that reveal the physics of variability to better understand future climate. Control simulation Simulation of the Dipole Mode To evaluate the degree to which these three models properly capture the dipole pattern in the 20th century integrations, we first ask if the models simulate reasonable SST variability in the Gulf of Guinea. We don’t expect that a coupled GCM would reproduce specific warm years from the observational record, but we look for reasonable numbers of anomalous years with magnitudes similar to those in the observations. The figure to the right (top) shows a cross-section of streamlines along the Greenwich meridian from the regional model control simulation (without warm SSTs in the Gulf of Guinea). Similar to the observed circulation, it features a low-level monsoon inflow across the Guinean coast (M), deep vertical motion associated with a precipi- tation maximum near 8ºN (P), and a more shallow region of upward motion over the thermal low (L). The outflow from the Saharan High (H) is southward. (The African easterly jet forms when Coriolis forces act on this northerly flow.) The bottom figure is the streamline cross-section when warm SSTAs are imposed in the Gulf of Guinea. The red arrow points to the southward outflow from the Saharan high, which has a larger meridional (and vertical) extent, and is located closer to the surface than in the control. Drying in the Sahel occurs because of these differences in the outflow due to shrinking of both planetary and relative vorticity (Vizy and Cook 2002). P H L M Mean = 298.05 K; 21 Warm years; range –1.06 to 1.17 K Mean = 299.01 K; 25 Warm years; range –1.51 to 2.19 K Mean = 299.83 K; 25 Warm years; range –1.09 to 0.72 K Mean = 298.56 K; 24 Warm years; range –0.71 K to 0.85 K Mean Gulf of Guinea temperatures are 1 K greater than the observations in the GFDL model, almost 2 K too warm in the MIROC simulations, and only 0.5 K too warm in the MRI model. Interannual variability is quite strong in the GFDL model, but only a little too subdued in MIROC and MRI. MRI has a slight warming trend in the 20th century, which is not observed. idealized warm Gulf of Guinea simulation The Observed North/South Dipole Response to Gulf of Guinea SSTAs The dipole precipitation anomaly pattern is generated in each of the models. The number of dipole events over the second half of the 20th century is reasonable in each model, and they generally occur when the Gulf of Guinea is warm. Composites of precipitation and the meridional circulation (as above) were formed by averaging years in which the dipole pattern appeared along with warm Gulf of Guinea SSTs (right hand column in the above table). Selection of Models for the Analysis We chose to analyze only coupled model runs that produced a reasonable simulation of the West African precipitation climatology in the 20th century integrations, and had posted 21st century runs by January 2005. Ten 20th century integrations were examined. Shown to the left are two versions of the observed JJAS precipitation climatology over Africa, along with precipitation climatologies from 10 different models runs. Only 4 produced reasonable representations of the African precipitation climatology for boreal summer. Therefore, the analysis of the dipole mode below uses output from: 1. gfdl_cm2_0 (hereafter, “GFDL”) 2. miroc3_2_medres (“MIROC”) 3. mri_cgcm2_3_2a (“MRI”) (The MIROC3_2_hires run also has a very good simulation of the climatology, but the 21st century run was not available.) The above figure (left) shows the observed precipitation anomaly over West Africa for 1984 from the GPCP observations. The figure on the right shows the surface temperature anomalies for summer 1984 from the NCEP reanalysis. This was a classic “dipole year”, with dry conditions in the Sahel, wet conditions along the Guinean coast, and positive SSTAs in the Gulf. The mode is quite prominent in statistical studies of observed rainfall, and is often so strong that one can see it clearly in individual years such as 1984. Physics of the North/South Dipole Response Vizy and Cook (2002) identified the physical mechanisms of the dipole response by analyzing output from processes studies conducted using a regional model with 120 km horizontal resolution. Regional climate model domain Idealized SSTA The composite dipole precipitation anomalies in the GFDL model are strong – over 2 mm/day. But the circulation anomalies associated with the dipole events are not the same as in the observations and the mesoscale model process study. (In some of the individual dipole years, the circulation is very similar to the observations, but not in the composite.) In the MIROC simulation, the composite circulation for dipole events does have the extended southward outflow from the Saharan High, and it is slightly lower as well. This, the mechanism by which the dipole precipitation anomaly is generated in this model is realistic. The composite circulation for dipole years in the MRI model also also captures the anomalies in the outflow from the Saharan high associated with the dipole in the observations and the mesoscale model process study. The regional model captures the north/south dipole response when forced with the above SSTA (figure to the right). Wet conditions along the Guinean coast coast occur when warming in the Gulf of Guinea enhances evaporation and the moisture content of the low-level air. Because there is large-scale subsidence over the Gulf of Guinea, however, convection is inhibited over the warm water and the increased moisture is fed into the coastal regions of the West African monsoon. Thus, a model must have a reasonable simulation of precipitation over the Congo basin, and the related subsidence to the west (a Walker circulation) to place the precipitation anomaly over the Guinean coast countries rather than over the SSTA. This is the southern part of the precipitation dipole, and it is generally captured in global models. • Conclusions • Of the 10 20th century integrations examined, only 4 produced reasonable climatologies of the West African • summer rainy season, namely, GFDL, MRI, and MIROC (medium and high resolution versions). • The MRI 20th century integrations produced a very accurate representation of the circulation associated with the • West African monsoon and the Saharan heat low. The MIROC simulation reproduced most features of the • observed circulation, while the GFDL model fails to capture the dynamics over the Saharan thermal low. • Each of the 3 models analyzed exhibits the precipitation dipole behavior that is a major observed mode of • variability over West Africa, and that is associated with dry years in the Sahel. In the models, as in the • observations, the occurrence of the dipole is usually associated with warm Gulf of Guinea SSTs. • In two of the three models analyzed, the dynamics of the dipole response is basically “correct”, i.e.,similar to the • observations and a process study using a regional model. • Overall, the MRI simulation examined here stands out among the 10 20th century integrations that we examined • for its accuracy in simulating the climatology and the physical mechanisms of a prominent model of interannual • variability over West Africa. This suggests that future projections from this model run can be viewed with • enhanced confidence. • A poster presented on Friday examines the 21st century integrations of these three models. Circulation cross sections for each of the three chosen models, averaged over the summer rainy season (JJAS) from 1949 – 2000 are shown below, along with the circulation from the NCEP/NCAR reanalysis averaged over the same time period.. The MRI model captures the full intricacy of the circulation that develops over West Africa in summer with the greatest accuracy. Both the MRI and MIROC models simulate the southward outflow from the Saharan high near 600 hPa and 15-18ºN. Precipitation perturbation in the regional climate model forced by the warm Gulf of Guinea SSTA . The northern part of the dipole anomaly, i.e., drying in the Sahel in response to warm Gulf of Guinea SSTAs, is captured less reliably in GCMs. A vorticity analysis of the regional model shows that the response occurs in association with changes in the mid-tropospheric outflow from the Saharan high (see next figure). Model resolution, or even grid point placement, can thwart a proper simulation of this part of the dipole signal. The low-level inflow and mid-tropospheric outflow associated with the surface thermal low and the Saharan high aloft must also be generated in the model simulation, suggesting that the simulation is sensitive to surface heat fluxes and the boundary layer parameterization in the model. AcknowledgementThis research was supported by the NSF SGER Program.