Download
1 / 42
420 likes | 492 Views
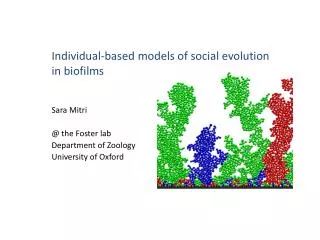
Testing Alternative Models of Social Evolution. Vickie L. Backus, Middlebury College Joan M. Herbers, Ohio State University. Disney View of Social Insects. Single queen Workers who are all sisters (r=0.75) Every individual working for the “good” of the nest

E N D
Testing Alternative Models of Social Evolution Vickie L. Backus, Middlebury College Joan M. Herbers, Ohio State University
Disney View of Social Insects • Single queen • Workers who are all sisters (r=0.75) • Every individual working for the “good” of the nest • Workers sacrifice own reproduction in order to help mother because this increases her own inclusive fitness.
Real world view of social insects • Number of queens can vary from 0–100’s • Workers may not be related to each other • Queens and workers may disagree on what is “best” for each other and the nest.
Potential conflicts in ant nests • How many resources to invest in each offspring (packaging decisions) • Invest in growth (workers) or reproduction (male and female alates) • Invest in males or female alates (sexual allocation)
Leptothorax longispinosus • <5 mm in length • Lives in pre–formed cavities in northern temperate forest • Nests usually <40 workers • Multiple queens in nests • Seasonal polydomy
Location of Studies • VT site-Mallett’s Bay State Park • NY site-Edmund Niles Huyck Preserve
Average Female Alate Weight Mean female weight (ug) NY82 NY83 NY87 NY88 NY89 NY90 VT82 VT83 VT86 VT87 VT88 VT89 VT90 Data Set
How do nests decide how to package new ants? • Herbers 1990 American Naturalist 136(2):178–208 • Backus 1993 Oecologia 95:283-289 • Both papers used path analysis but each paper took a slightly different approach to constructing the paths
Herbers 1990 Model A • Path model where alate weight (GF and GM) are determined directly by nest demographics (Q=Queen number; W=Worker number).
Herbers 1990 Model B • Alate weight (GF and GM) are determined after nests have decided how much energy to allocate to each sex. • F= total biomass of females • M=total biomass of males
Methods used by Herbers 1990 • Decompose the paths using the “rules” presented in Li 1975 • Standardize the variables (Q, W, GF, GM, F and M) with mean=0 and s2=1.0 • Calculate multiple-regression coefficients for the standardized variables=path coefficients
Methods of Herbers 1990 • Test internal consistency by comparing observed correlations of internal variables with that expected under the model
Testing internal consistency • Expected correlation between GF and GM = qq’ + ww’ +qw’RQW + q’wrQW
Results of Herbers 1990 analysis • Neither model showed consistent strong fit with the data but the fit was in the same direction for model A
Enhanced path model for packaging decisions (Backus 1993) • Nest demographics still the heart of the model • Addition of maternal effects (mean queen mass) as an independent variable • Addition of worker packaging as a dependent variable
One other issue… • Path analysis produces very large data sets • E.G. 9 path coefficents for every data set analyzed • Backus 1993 analyzed 6 data sets; Herbers 1990 another 7
Presentations in print can accommodate large data sets • Large data table from Backus 1993 showing the path coefficients for the 6 data sets for each of 3 dependent variables.
Graphical presentation of data • Both magnitude and direction of coefficients shown
What did we find out about packaging decisions? • Able to detect some detailed trends in packaging. • Example of packaging of males from Backus 1993
Two strong conclusions emerged: • Significant queen worker conflict to packaging occurred. • The proposed models don’t explain the whole story
Evidence of queen worker conflict in the path analysis • Data for female alates as an example. • Direction of coefficients different for queens and workers in 7/10 data sets
Why so little variation explained? • Many unexplained variables • Requires a deep understanding of the biology of the system • Clearest use of the technique is when you have two equally realistic models and want to determine which is correct
Queen–worker conflict in Hymenoptera • Haplio-diploid sex determination system is critical • Q-females, sons or workers r=0.5 • W-sisters (females or new workers) r=0.75 • W-brothers r=0.25
Prediction for sexual allocation decisions: • Queens and workers have different optima for sexual allocation • Queens prefer equal investment in new female alates and males. • Workers prefer biased investment with most biased being 1:3 males:females • Trivers and Hare 1976
Allocation to Males 0.9 0.8 0.7 0.6 0.5 Allocation to males (0=all female) 0.4 0.3 0.2 0.1 0 NY81 NY82 NY83 NY87 VT82 VT83 VT84 VT85 VT86 VT87 Data set
Herbers 1990 Am. Nat. 136(2):178–208. • Leptothorax longispinosus • Queen number and worker number as independent variables • Final dependent variable is proportional allocation to males.
Major conclusions from Herbers 1990 • Evidence for significant queen-worker conflict • Variation in the effect of nest demographics is important • Nest demographics doesn’t explain everything.
What about growth? • Reproduction isn’t the only allocation decision that nests need to make.
Backus (1995 American Naturalist 145(5):775–796) • Added growth to the model. • Tested alternative models for how nests may be making allocation decisions.
Comparing the two models • Model A: proximate level factors important • Model B: ultimate level (selection) important
Which model fits the data? • Internal consistency tested. • Compared the inferred correlation between GB and RB for both models with the observed correlations.
Further conclusions from the analysis of the two models: • Natural selection is acting differently on the two populations • Queen-worker conflict does occur over the decision to grow or reproduce. • Nest demography is important
What has path analysis allowed us to conclude? • Conflict occurs over all types of allocation decisions made ant nests • Different populations have different levels of conflict • Different populations may apply different rules to allocation decisions • Nest demography is important but not the only factor to consider in allocation decisions.
Acknowledgments • JMH’s work funded by National Academy of Sciences, E. N. Huyck Preserve, National Science Foundation • VLB’s work funded by E. N. Huyck Preserve and Sigma Xi. Presentation of this talk funded in part by Middlebury College. • Samuel Scheiner for inviting me to present this work.


![[Alternative Ownership Models]](https://cdn2.slideserve.com/5345939/alternative-ownership-models-dt.jpg)