Download
1 / 33
340 likes | 372 Views
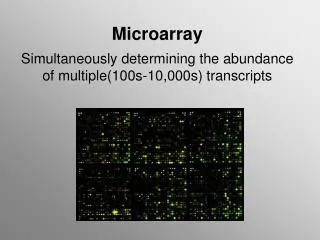
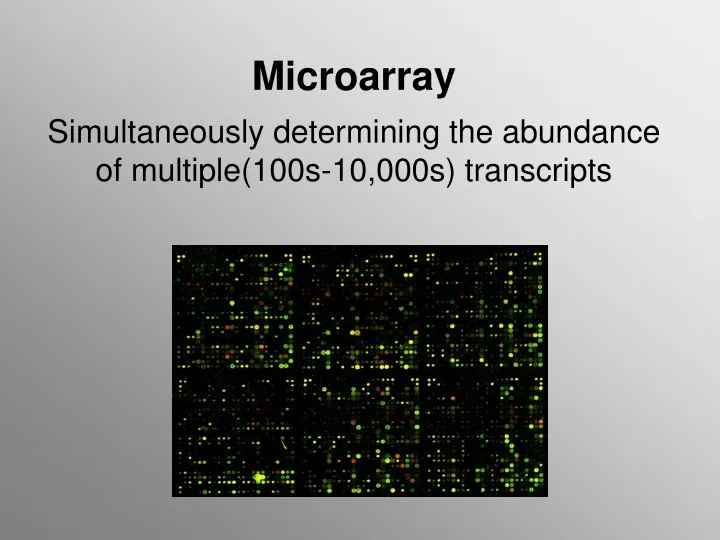
Microarray. Simultaneously determining the abundance of multiple(100s-10,000s) transcripts. Gene expression assays. DNA microarrays rely on the hybridization properties of nucleic acids to monitor transcript or RNA abundance on a genome-wide scale in different types of cells.

E N D
Microarray Simultaneously determining the abundance of multiple(100s-10,000s) transcripts
Gene expression assays DNA microarrays rely on the hybridization properties of nucleic acids to monitor transcript or RNA abundance on a genome-wide scale in different types of cells. The main types of gene expression assays: • High-density nylon membrane arrays (macroarrays) • Short oligonucleotide arrays (Affymetrix) • Long oligonucleotide arrays (Agilent) • cDNA arrays • genome arrays http://www.bioconductor.org/workshops/ShortCourse012302/
Uses for Microarray Determination of transcript (mRNA) abundanceIdentification of genes (hypothetical, microRNA)Diagnostics (disease, stress, chemicals, or pharmaceuticals)Distinguish signaling pathwaysDetermination of RNA decay rates http://www.bioconductor.org/workshops/ShortCourse012302/
Microarray Experiments; different approaches to compare mRNA accumulation Different tissues, same organism (brain versus liver) Same tissue, same organism (treatment versus control, tumor versus normal) Same tissue, different organisms (wild-type versus knockout or mutant) Time course experiments (effect of treatment, development) Other special designs (e.g. to detect spatial patterns) http://www.bioconductor.org/workshops/ShortCourse012302/
Overview of the process Question Data Analysis Sample Preparation Microarray Detection Microarray Hybridization http://www.bioconductor.org/workshops/ShortCourse012302/
Overview of the process Prepare RNA and label cDNA Make Chip Genomic DNA or cDNA Grow and/or treat sample PCR fragment purification and preparation Isolate RNA Print array cDNA synthesis and labeling Hybridization Data analysis
Genomic versus complementary DNA Amplification of genomic DNA with the Polymerase Chain Reaction(PCR) Amplification of complementary DNA (cDNA)with the Polymerase Chain Reaction(PCR) mRNA AAAAA RT TTTTTT Oligo-T primer dNTPs http://stein.cshl.org/genome_informatics/guest_lectures_2003/OlgaLecture.pdf Reverse transcriptase (RT)
Denaturation Step 94oC for 1 min. Annealing Step 45-65oC for 30 sec. 25-30 cycles Extension Step 72oC for 2-5 min. PCR Taq Taq
Copies of target DNA 2 4 8 16 Target DNA Number of cycles 1 2 3 4 PCR Exponential increase in target DNA
Building a cDNA chip Consolidate into plates PCR amplification of target DNA (cDNA or portion of genomic DNA) Arrayed Library (96 or 384-well plates of bacterial glycerol stocks) Spot as microarray on glass slides http://www.bioconductor.org/workshops/ShortCourse012302/
Make Chip Glass slide http://www.bioconductor.org/workshops/ShortCourse012302/ http://www.doc.ic.ac.uk/~yg/course/bioinformatics/2_bioarray-Normalization-lecture.ppt
Microarray Analysis http://www.genomics.arizona.edu/553/syllabus.html
Isolate polyA+ RNA from treatment, mutant, or transgenic organism Reverse transcribe and label Reverse transcriptase Oligo-T primer dNTPs (Cy5 labeled) Single stranded cDNA (antisense) Cy5 labeled Label cDNA Isolate polyA+ RNA from control (wild-type or non-treated) Reverse transcribe and label Reverse transcriptase Oligo-T primer dNTPs (Cy3 labeled) AAAAA AAAAAA TTTTTT TTTTTT Single stranded cDNA (antisense) Cy3 labeled
3’-CCCGGGTACGTAAATTCGTACCCTACGTA-5’ III III III III III III II II III III II II II II II II III III II II III III III II II III III II II 3’-CCCGGGTACGTAAATTCGTACCCTACGTA-5’ 5’-GGGCCCATGCATTTAAGCATGGCATGCAT-3’ Matrix Hybridization of nucleic acids DNA fixed to a matrix matrix = membrane (nylon or nitrocellulose) or glass III III III III III III II II III III II II II II II II III III II II III III III II II III III II II
Expression profiling with DNA microarrays cDNA “control” Cy3 labeled cDNA “treament” Cy5 labeled Laser 1 Laser 2 Scanning Hybridization + Analysis Image Capture
Hybridization chamber 3XSSC • Humidity • Temperature • Formamide HYB CHAMBER ARRAY LIFTERSLIP SLIDE LABEL SLIDE LABEL http://www.bioconductor.org/workshops/ShortCourse012302/
Microarray Analysis Data storage and retrievalFilteringNormalizationAnalysis http://www.bioconductor.org/workshops/ShortCourse012302/
Image analysis http://www.bioconductor.org/workshops/ShortCourse012302/
Quantification Cy5 at 635 Cy3 at 532 Overlay images
cDNA “treament” Cy5 labeled cDNA “control” Cy3 labeled 1 6 1 3 2 3 2 2 2 2 2 5 5 5 5 5 4 3 5 2 3 3 3 6 2 6 4 6 6 6 6 6 6 6 6 5 5 5 5 5 5 Relative intensity 5 5 5 5 Relative intensity Output Output 1 1 6 Expression profiling with DNA microarraysData acquistion HYBRIDIZATION Spot #1 Spot #4 Spot #2 Spot #5 Spot #3 Spot #6
Sample preparation http://stein.cshl.org/genome_informatics/guest_lectures_2003/OlgaLecture.pdf
Microarray Analysis Data storage and retrievalFilteringNormalizationAnalysis
Microarray Analysis Data Quality • Irregular size or shape • Irregular placement • Low intensity • Saturation • Spot variance • Background variance miss alignment artifact bad print indistinguishable saturated http://www.mscs.mu.edu/~cstruble/class/mscs230/fall2002/notes/
Replicate spots http://www.genomics.arizona.edu/553/syllabus.html
Reverse-dye label Reverse-dye label Reverse Dye-Label
Microarray Analysis Hierarchical Clustering http://www.mscs.mu.edu/~cstruble/class/mscs230/fall2002/notes/
Get a Global Perspective;Plot Data on a Metabolic Chart Data set from an experiment with Arabidopsis http://www.botany.utoronto.ca/courses/bio472/test_dataset_aracyc.txt Metabolic pathway analysis http://www.arabidopsis.org/tools/aracyc/ http://www.genomics.arizona.edu/553/syllabus.html
Microarray Analysis Tutorial Cluster and TreeView Tutorial as part of a course (outline, test,data and links to free downloads http://www.botany.utoronto.ca/courses/bio472/ Tutorial outline http://www.botany.utoronto.ca/courses/bio472/Microarray_tutorial_WS2004.pdf Free download from http://rana.lbl.gov/EisenSoftware.htm Data set for cluster and treeview http://www.botany.utoronto.ca/courses/bio472/test_dataset.txt http://www.genomics.arizona.edu/553/syllabus.html