Download
1 / 31
310 likes | 507 Views
Impact of Climate Change on Water Resources. Water Corporation Technical Seminars 10 July 2006 Brian Ryan CSIRO Marine and Atmospheric Research. Acknowledgements. IOCI Colleagues Bureau of Meteorology, CSIRO Marine and Atmospheric Research, CSIRO Land and Water,

E N D
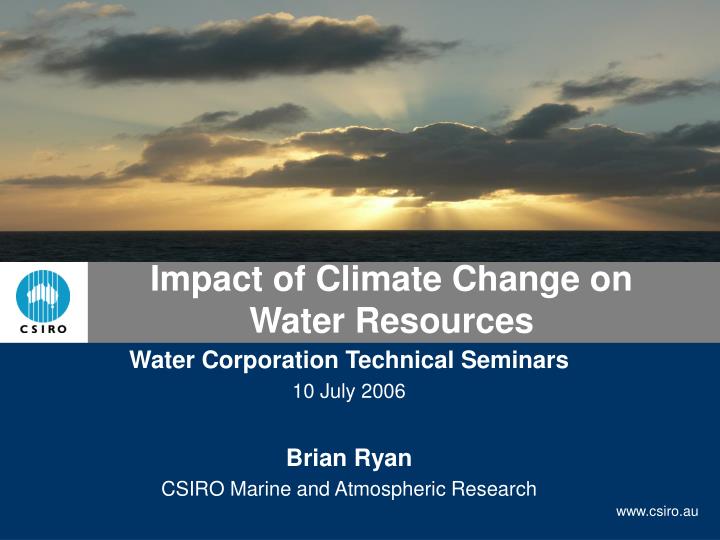
Impact of Climate Change on Water Resources Water Corporation Technical Seminars 10 July 2006 Brian Ryan CSIRO Marine and Atmospheric Research
Acknowledgements • IOCI Colleagues • Bureau of Meteorology, • CSIRO Marine and Atmospheric Research, • CSIRO Land and Water, • CSIRO Mathematics and Information Sciences, • Brian Sadler and Ed Hauck • And specifically Roger Jones (CMAR) for work on impact of climate change on water resources in Australia
Impact of Climate Change on Water Resources • How has climate change? • Is the evidence for anthropogenic climate change? (Greenhouse Gases and Aerosols) • What can we say about the future climate? • What is the likely impact of climate change on water resources? • What are the threats to the water sector of climate change?
IPCC Third Assessment Report ‘An increasing body of observations give a collective picture of a warming world and other changes to the climate system’
How have sea surface temperatures in the Indian Ocean Basin changed?
How has Australian rainfall changed? http://www.bom.gov.au/silo/products/cli_chg/index.shtml
Abrupt shifts in Australian annual rainfall 1890-99 1940-45 1967-69
How has the rainfall of South-western Western Australia changed? May-July SW WA Rainfall Time series of SWWA rainfall (mm). Solid trace depicts early winter (May to July) totals and dotted trace late winter (August to October) totals. Means for the periods 1900 to 1974 and 1975 to 2004 are represented by horizontal lines.
How has the frequency of “wet” synoptic patterns (& June-July rainfall) changed? Decrease in rainfall associated with “troughs to west” types accounts for ~30% Decrease in frequency of “wet” types accounts for ~50% of rainfall decrease
Summary of how the Regional Climate of SWWA has changed. • Temperatures have increased by about 0.8C since 1910 with most of increase since 1950 • Daily minimums have increased more than daily maximums • Sea surface temperatures in the averaged over the Indian Ocean basin have increased by 0.6C • Since 1970 the number of storms have decreased and they bring less rain • Annual rainfall has decreased by 10% since 1970s • May-July rainfall has decreased by 15% since 1970s • Reduced rainfall has resulted in 50% less runoff • Key Message: Water managers can not assume that the climate baselines of the 20th century will be valid in the 21st century
Is it possible to model the observed temperature and rainfall changes?
What can we say about the attribution of the drying in SWWA • The decline in the number of storms is linked with large-scale global circulation changes (in about 1970); • It is feasible that the drying trend could have been the result of unforced climate variability; • However, the decline in rainfall is also consistent with the modelled effect of anthropogenic forcing; • Changes in land cover may also have contributed to the rainfall decline.
What can we say about the future? Emission scenarios
Global Temperature Rise • Global temperatures and sea level are projected to rise under all IPCC emission scenarios • Projected warming of 1.4-5.8oC between 1990 and 2100 • Projected warming of 0.54-1.24oC between 1990 and 2030 • Projected warming of 1.17-3.77oC between 1990 and 2070 • At least half of uncertainly relates to uncertainties in emissions, the rest to uncertainties in climate science • Changes will persist for centuries
SRES 450 ppm May to October 550 ppm 2030 2070 November to April SWWA: Range of projections for changes of temperature from nine international models
SWWA: Range of projections for changes of rainfall from nine international models
L 1012 1016 1020 1016 1012 H Some Weather Types L 1012 .2 .4 .6 .8 1 3 1016 H H Type 1016 1012 1004 1000 1008 5 .2 .4 .6 .8 1 Type
SWWA winter weather state probabilities from stochastic downscaling of Mk3 Winter Seasonal Totals (% of median for 30 SWWA rainfall station) Scenario 2030-2064 A2 80-90% B2 84-91% A1B 87-91% B1 97-99% S(20) 96-99% Baseline 1975-2004 (A2 dots, B2 small dash, B1 medium dash, A1B long dash and ‘committed’ dot-dash).
Key Message • The climate change simulations show • that even with the lowest conceivable greenhouse gas emission scenarios, • the south-west of Western Australia is projected to be drier and warmer later in the century, • with an increasing probability of dry weather patterns and a decreased probability of wet weather patterns
P and Ep changes for south-western Australia Change per degree global warming
What is the likely impact of climate change on water resources? • Hydrological model sensitivity • Relate change in mean annual rainfall and potential evaporation to mean annual change in runoff (%) • ∂Q = ∂P × A + ∂Ep × B • The further A and B are from zero, the more sensitive that factor is
Simple model of mean flow changes – MDB (2030) Vertical lines measure range from ten models with a global warming range from 0.54-1.24C. The central box is range of change at 0.85C (median) global warming
Provisional results relating runoff response to climate change for the MDB
Simple model of mean flow changes – SW WA (2030) Vertical lines measure range from ten models with a global warming range from 0.54-1.24C. The central box is range of change at 0.85C (median) global warming
Reduction in mean monthly inflow to Stirling Dam (Berti et al 2004) using the current (1982-2002)and future (2042-2062) GCM simulations Annual % decrease in stream flow is 31%
IOCI “Living with our changing climate workshop” • Key Impacts on Water Sector • Reduced reliability of public supply • Reduced reliability of private supply • Reduced stream and estuary flow and water quality reducing ecological and social values • Drying of ground water reliant systems • Reduced water availability for fire fighting • Challenged regulatory and management systems • Seasonally variable flooding • Stranded underperforming assets and infra structure
IOCI “Living with our changing climate workshop” • Water Sector Climate Science Priorities • Better understanding of the dynamics of climate change and variability, including rainfall for south-west WA, to provide data for policy and planning; • Developing of probabilities around climate scenario estimates; • Distinguishing between climate change and climate variability; • Differentiating effects on summer and winter rainfall; • Breaking down spatial trends between north to south and east and west, and even within the south-west; and • Understanding of meteorological shifts that have or will occur.
Thank You Contact CSIRO Phone: 1300 363 400+61 3 9545 2176Email: enquiries@csiro.auWeb: www.csiro.au Contact Name: Dr Brian RyanPhone: 61 3 9333 6554Email: brian.ryan@csiro.auWeb: www.marine.csiro.au