Download
1 / 36
360 likes | 488 Views
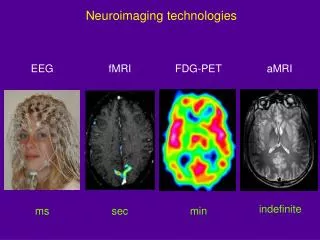
2009 Multimodal Neuroimaging Training Program fMRI Module: Experimental Design, Image Processing, & Data Analysis. Courtney M. Bell, Gina D’Angelo, Huiqiong Deng, Arava Kallai, Kamrun Nahar Ikechukwu Onyewuenyi, William Ottowitz. Mark Wheeler, Instructor, Elisabeth Ploran, TA. Overview.

E N D
2009 Multimodal Neuroimaging Training Program fMRI Module: Experimental Design, Image Processing, & Data Analysis Courtney M. Bell, Gina D’Angelo, Huiqiong Deng, Arava Kallai, Kamrun Nahar Ikechukwu Onyewuenyi, William Ottowitz Mark Wheeler, Instructor, Elisabeth Ploran, TA
Overview • Introduction • Experimental Design • Preprocessing • Data Analysis • Blocked Design Example • Finger Tapping • Event Related Design Example • Categorization
Blocked vs. Event Related Blocked Design Event Related Design
Data Acquisition & Parameter Selection • Scanner : Siemens 3T • Anatomical Scans • T1 (MPRAGE) • Slices : 176 • Voxel Size: 0.5mm x 0.5mm x 1.0mm • Rationale • Functional Scans • Finger Tapping Task & Categorization Task • Whole Brain Scan • Slices : 38 • Voxel Size : 3.2mm x 3.2mm x 3.2mm • Interleaved Acquisition • TR : 2s • T2* Contrast • Rationale • N = 7 (Males = 3; Females = 4) • 6 R; 1L
Preprocessing Steps • Reformat • Time Shift • Motion Correction • Smoothing • Scaling
Data Transformation • Background • Images from scanner collected in DICOM format • DICOM format cannot be interpreted by AFNI • AFNI : Analysis software • Purpose: • Convert DICOM files to AFNI format
Time Shifting • Background: • Slices acquired in interleaved fashion to prevent “bleeding” • Odd slices collected first; even slices collected second • Data from consecutive slices taken at half TR • May get hemodynamic response that is slightly phase shifted • Purpose: • To “guess” (interpolate) what BOLD response would look like if occurred at the same time across all slices
Motion Correction • Background • Subjects move during data acquisition • Therefore, voxel timeseries not referring to the same position over time • Creates need to select “base” image for voxel realignment • Purpose • Reposition voxels in accordance with the selected base image • Criteria for selecting base image • Point at which have least likelihood of scanner “drift” • Point at which have maximal participant and scanner stability • Early vs. middle images
Smoothing • Background • fMRI signal is noisy • Different subjects can have slightly different areas of activation • Purpose • To improve signal to noise ratio by removing noise • To improve detection power in group analysis • Current Project • Tested 0, 4, and 6 mm FWHM Gaussian smoothing kernel • Disadvantages • Changes the data • Results in correlated voxels
Smoothing 3.2mm - No Smoothing 4mm Smoothing 6mm Smoothing
Scaling • Background • Data represented as BOLD signal intensity • Arbitrary raw signal • Need relative comparison to make data meaningful • Purpose • Goal is to scale a voxel time series by its mean in order to do group analysis
Data Analysis • Project Specific Analyses • Possible data analysis • Define regressors • Assume shape of BOLD response (?) • Perform statistical analyses • Generate significance maps • Use predefined ROIs
Block Design Implementation • Finger-tapping Task • Localization Task
Digit 1 vs. Digit 5: An fMRI Study of Finger-tapping Topography
Motor Homunculus Huettel et al. 2009
Finger-Tapping Motor Task • Multi-finger sequential tapping task (3 mins) • D1 and D5 responses are evoked in separate blocks • Visual pacing stimulus (externally guided) 20s 20s 20s 20s 20s x 2
Data Analysis • Conditions • Tap vs. Rest • D1 vs. Rest • D5 vs. Rest • D1 vs. D5 • Creating regressors for AFNI • Rest periods were identified as “0”; tap periods as “1” • D1 is “1” when tapping D1 and “0” otherwise • D5 is “1” when tapping D5 and “0” otherwise
Data Analysis • General Linear Model • Red - Assumed HRF Model • Black - Regressor
Tapping (D1 + D5) vs. Rest R • Tap (D1+D5) vs. Rest • Finger-tapping relative to rest produced significant lateralized activation in the left precentral gyrus (BA4; -38, -20, 55). • α = 0.01.
D1 vs. Rest – group analysis • D1 vs. Rest • Left precentral gyrus (-54, -9, 32) • α = 0.01. R
D5 vs. Rest – group analysis • D5 vs. Rest • Left precentral gyrus (-60, -5, 32) • α = 0.01. R
D1 vs. D5 - Individual Analysis D1 vs. D5 D1 is anterior to D5 which is consistent with the electrode studies R
D1 vs. D5 - Group Analysis R • Blue regions indicates increased activity to D1 tapping; red is for D5 response. • Activation for D1 was localized in left BA4 (-56, -17, 35); however, a distinct motor area was not identified for D5. • α = 0.05
Summary • Localized finger-tapping region in primary motor cortex • Group analysis only identified distinctive motor cortex areas for D1 - not D5 • Efficiency of group analysis for this dataset • Variation in the anatomical location of D1 and D5 • Limited significance in group activation
Event Related Design Implementation • Categorization Task
Easy Face + + + + Categorization Task Event related design used for increased estimation power & trial sorting 3 runs x 213 TRs (80 stimuli, 20 of each type) Hard Object Jitter (2s, 4s, or 6s) Easy Object Hard Face
HYPOTHESES • Face vs. Object activation map • Different locations in Fusiform Gyrus • Hard vs. Easy • Frontal activation during decision making
INDIVIDUAL CATEGORIZATION DATA (α= 0.01) Face Object
GROUP CATEGORIZATION DATAFACE VS. OBJECT (α= 0.01) Talairach coordinates: X = 43, Y = -54, z = -7 Right Fusiform Gyrus BA: 37 Talairach coordinates: X = 16, Y = -23, z = -9 Right Parahippocampal Gyrus BA: 35 Object Face
GROUP CATEGORIZATION DATAEASY VS. HARD (α = 0.01) Talairach coordinates: X = 4, Y = 23, Z = 10 (4 mm from) Right ACC BA: 24 * Note: On white matter Easy > Hard
Summary of Categorization • Group results • Faces more prominent than objects • Faces vs. Objects : FFA (BA 37) and PPA • Easy vs. Hard : Anterior Cingulate Cortex (ACC) • Relatively consistent with individual results • Some individual results showed both face vs. object and easy vs. hard activations
Overall Summary • Learned basic concepts associated with fMRI • Physics • Design • Data Collection • Preprocessing • Analysis • Applied basic concepts using small sample • Discussed possible limitations and future directions