Download
1 / 13
130 likes | 138 Views
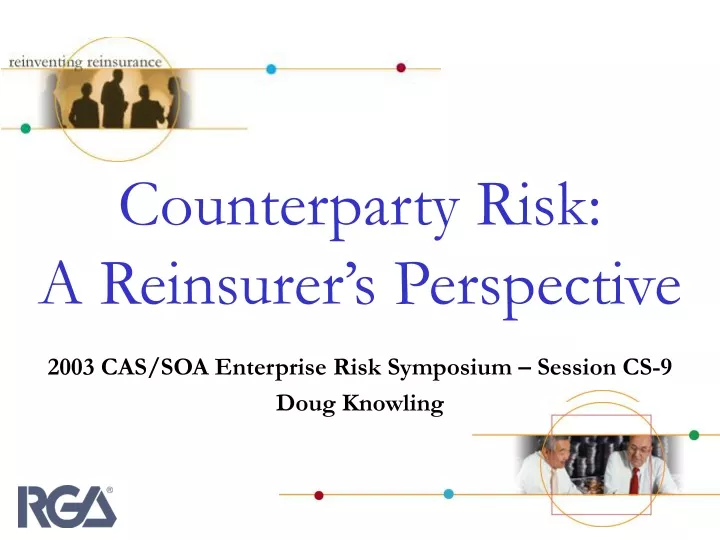
Counterparty Risk: A Reinsurer’s Perspective. 2003 CAS/SOA Enterprise Risk Symposium – Session CS-9 Doug Knowling. Agenda. What is it? What causes it? How is it measured? How is it managed? Practical issues for implementation. What Is It?.

E N D
Counterparty Risk:A Reinsurer’s Perspective 2003 CAS/SOA Enterprise Risk Symposium – Session CS-9 Doug Knowling
Agenda • What is it? • What causes it? • How is it measured? • How is it managed? • Practical issues for implementation
What Is It? • Threat that payment owed from ceding company or retro won’t be made due to financial impairment of the counterparty
What Causes It? RGA Cedants (Allowances) Retros (Reserve Credits)
How Is It Measured? • Two risks evaluated (analogy to mortgages) • Run on the bank (LTV ratio) • Collection risk (can’t foreclose) • Potential net GAAP losses • Projected asset and liability balances
How Is It Measured? Collection Risk • Measured as GAAP loss incurred by RGA under “melt down” scenario • Projected GAAP balance sheets • Assumes all deals terminated without any termination settlement between companies • Reflects retrocessions only if collection risk was passed to retro
How Is It Measured? Run On The Bank Risk • Measured as GAAP loss under spike lapse • each and every future year • greater of (40%, 2 times expected) • guideline only – actuarial judgment required • Reflects retrocession recoveries adjusted for credit rating of retro and time to exposure
How Is It Measured? Simple Example
How Is It Measured? Complicating Factors • Look at treaty by treaty • Individual projections • Recognize unique transaction features • Isolate “positive” exposures • Evaluated for all deals with a specific company or any of its affiliates • Open treaties
How Is It Managed? • Limits on amount of exposure willing to take with any one counterparty • Ensure transactions are properly collateralized • Scrutinize counterparties prior to entering into any transaction and monitor going forward
How Is It Managed? Basis For Counterparty Limits • Relative risks based on historical default rates • Set comfort level of exposure for 1-year A • Limits for all years and ratings • Probability of default in year t (“tPxQx+t”) • Ratio of “tPxQx+t” to “Qx” for 1-year A • Provision for growth • May want to constrain and smooth
Years from Current Date Rating 1 2 3 4 5 10 20 30 AAA 100 110 121 133 146 76 53 72 AA 100 74 51 41 35 24 26 46 A 40 27 20 17 14 11 16 35 BBB 8 6 5 4 4 4 4 4 How Is It Managed? Sample Risk Limits
Practical Issues For Implementation • Need corporate database of current exposures • Layer on new deals • Coordination among divisions • Approximations given complexity • What to do for non-rated companies • Interaction effects among counterparties