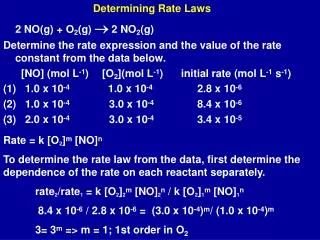
Download
1 / 35
360 likes | 494 Views
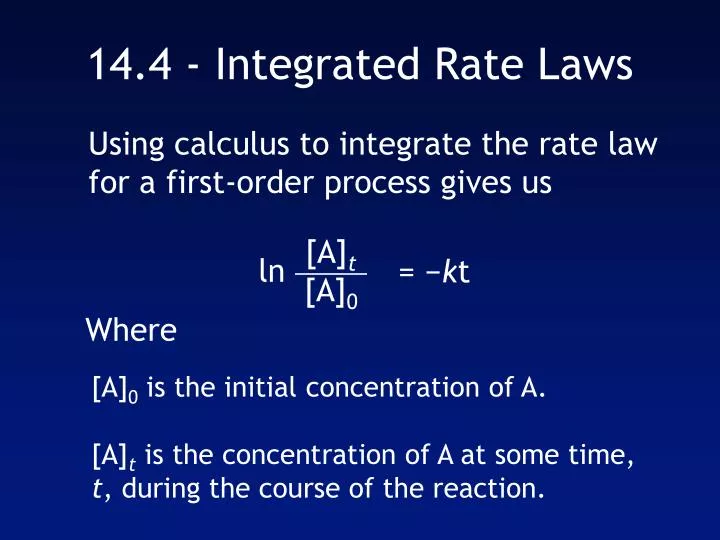
ln. = − k t. [A] t [A] 0. 14.4 - Integrated Rate Laws. Using calculus to integrate the rate law for a first-order process gives us. Where. [A] 0 is the initial concentration of A. [A] t is the concentration of A at some time, t , during the course of the reaction. ln. = − k t.

E N D
ln = −kt [A]t [A]0 14.4 - Integrated Rate Laws Using calculus to integrate the rate law for a first-order process gives us Where [A]0 is the initial concentration of A. [A]t is the concentration of A at some time, t, during the course of the reaction.
ln = −kt [A]t [A]0 Integrated Rate Laws Manipulating this equation produces… ln [A]t− ln [A]0 = − kt ln [A]t = − kt + ln [A]0 …which is in the form y = mx + b
14.4 – First-Order Processes ln [A]t = -kt + ln [A]0 Therefore, if a reaction is first-order, a plot of ln [A]t vs. t will yield a straight line, and the slope of the line will be -k. On your equation page as: ln[A]t – ln[A]0 = -kt
CH3NC CH3CN First-Order Processes Consider the process in which methyl isonitrile is converted to acetonitrile.
CH3NC CH3CN First-Order Processes This data was collected for this reaction at 198.9°C.
First-Order Processes • When ln P is plotted as a function of time, a straight line results. • Therefore, • The process is first-order. • k is the negative slope: 5.1 10-5 s−1.
1 [A]0 1 [A]0 1 [A]t 1 [A]t = −kt + = kt Second-Order Processes Similarly, integrating the rate law for a process that is second-order in reactant A, we get also in the form y = mx + b On your equation page as:
1 [A]0 1 [A]t = −kt + Second-Order Processes So if a process is second-order in A, a plot of 1/[A]t vs. t will yield a straight line, and the slope of that line is k.
NO2(g) NO (g) + 1/2 O2(g) Second-Order Processes The decomposition of NO2 at 300°C is described by the equation and yields data comparable to this:
Second-Order Processes • Graphing ln [NO2] vs.t yields: • The plot is not a straight line, so the process is not first-order in [A].
Second-Order Processes • Graphing ln 1/[NO2] vs. t, however, gives this plot. • Because this is a straight line, the process is second-order in [A].
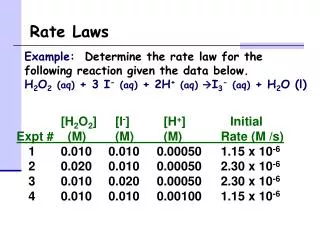
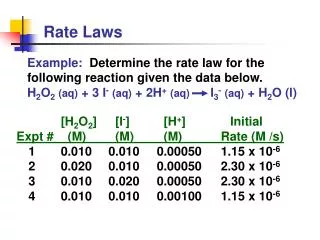
SAMPLE EXERCISE 14.8 Determining Reaction Order from the Integrated Rate Law The following data were obtained for the gas-phase decomposition of nitrogen dioxide at 300°C, Is the reaction first or second order in NO2?
SAMPLE EXERCISE 14.8continued Solve: In order to graph ln[NO2] and 1/[NO2] against time, we will first prepare the following table from the data given:
Figure 14.8 Kinetic data for decomposition of NO2. The reaction is NO2(g) NO(g) + 1/2O2(g), and the data were collected at 300°C. (a) A plot of [NO2] versus time is not linear, indicating that the reaction is not first order in NO2. (b) A plot of 1/[NO2] versus time is linear, indicating that the reaction is second order in NO2. SAMPLE EXERCISE 14.8continued As Figure 14.8 shows, only the plot of 1/[NO2] versus time is linear. Thus, the reaction obeys a second-order rate law: Rate = k[NO2]2. From the slope of this straight-line graph, we determine that k = 0.543 M–1 s–1 for the disappearance of NO2. PRACTICE EXERCISE Consider again the decomposition of NO2 discussed in the Sample Exercise. The reaction is second order in NO2 with k = 0.543 M–1s–1. If the initial concentration of NO2 in a closed vessel is 0.0500 M, what is the remaining concentration after 0.500 h? Answer: Using Equation 14.14, we find[NO2] = 1.00 10–3M
Half-Life • Half-life is defined as the time required for one-half of a reactant to react. • Because [A] at t1/2 is one-half of the original [A], [A]t = 0.5 [A]0.
0.5 [A]0 [A]0 ln = −kt1/2 0.693 k = t1/2 Half-Life For a first-order process, this becomes NOTE: For a first-order process, the half-life does not depend on [A]0. ln 0.5 = −kt1/2 −0.693 = −kt1/2
1 k[A]0 1 [A]0 1 [A]0 1 [A]0 2 [A]0 1 0.5 [A]0 2 − 1 [A]0 = kt1/2 + = kt1/2 + = = kt1/2 = t1/2 Half-Life For a second-order process,
14.5 - Temperature and Rate • Generally, as temperature increases, so does the reaction rate. • This is because k is temperature dependent.
The Collision Model • In a chemical reaction, bonds are broken and new bonds are formed. • Molecules can only react if they collide with each other.
The Collision Model Furthermore, molecules must collide with the correct orientation and with enough energy to cause bond breakage and formation.
Activation Energy • In other words, there is a minimum amount of energy required for reaction: the activation energy, Ea. • Just as a ball cannot get over a hill if it does not roll up the hill with enough energy, a reaction cannot occur unless the molecules possess sufficient energy to get over the activation energy barrier.
Reaction Coordinate Diagrams It is helpful to visualize energy changes throughout a process on a reaction coordinate diagram like this one for the rearrangement of methyl isonitrile.
Reaction Coordinate Diagrams • It shows the energy of the reactants and products (and, therefore, E). • The high point on the diagram is the transition state.
Reaction Coordinate Diagrams • The species present at the transition state is called theactivated complex. • The energy gap between the reactants and the activated complex is the activation energy barrier.
Maxwell–Boltzmann Distributions • Temperature is defined as a measure of the average kinetic energy of the molecules in a sample. • At any temperature there is a wide distribution of kinetic energies.
Maxwell–Boltzmann Distributions • As the temperature increases, the curve flattens and broadens. • Thus at higher temperatures, a larger population of molecules has higher energy.
Maxwell–Boltzmann Distributions • If the dotted line represents the activation energy, as the temperature increases, so does the fraction of molecules that can overcome the activation energy barrier. • As a result, the reaction rate increases.
Maxwell–Boltzmann Distributions This fraction of molecules can be found through the expression where R is the gas constant and T is the Kelvin temperature. f = e−Ea/RT
14.6 - Reaction Mechanisms • A balanced chemical equation tells us what substances are present at the beginning of a reaction and what is formed as the reaction proceeds. • It does not tell us how a reaction occurs
14.6 - Reaction Mechanisms • The process by which a reaction occurs is the reaction mechanism • A reaction mechanism can describe in detail the order in which bonds are broken and formed and the changes of relative positions of atoms in a reaction
14.6 – Elementary Reactions • Reactions that occur in a single event or step are called elementary reactions • The number of molecules that participate as reactants determine the molecularity of a reaction
14.6 – Elementary Reactions • A single molecule is a unimolecular reaction • The collision of two molecules is a bimolecular reaction • Three molecules is termolecular
bimolecular • dimolecular • termolecular • unimolecular
bimolecular • dimolecular • termolecular • unimolecular
Reaction Mechanisms The molecularity of a process tells how many molecules are involved in the process.