Download
1 / 24
240 likes | 339 Views
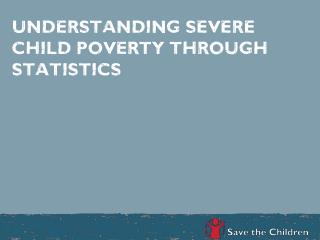
Serving Through Statistics. Joshua B . Wilkerson Navasota High School CAMT 2012 Houston, TX. Serving Through Statistics CAMT 2012. Serving Through Statistics . Overview Genesis of the Project Implementation Reflections Resources Q & A. Serving Through Statistics CAMT 2012.

E N D
Serving Through Statistics Joshua B. Wilkerson Navasota High School CAMT 2012 Houston, TX
Serving Through Statistics CAMT 2012 Serving Through Statistics • Overview • Genesis of the Project • Implementation • Reflections • Resources • Q & A
Serving Through Statistics CAMT 2012 I. Overview
Serving Through Statistics CAMT 2012 II. Genesis of the Project • The Previous “Spring Project” • The Concept of Service-Learning • Putting it into Practice
Serving Through Statistics CAMT 2012 II.A. The Previous “Spring Project” • Form a Hypothesis • Design a Study • Conduct the Study • Collect the Data • Describe the Data • Draw Conclusions from the Data
Serving Through Statistics CAMT 2012 II.A. The Previous “Spring Project” • Problems… • Didn’t reflect the students’ best work (as compared with their fall projects) • Lack of motivation • Similarity to science fair projects • Typically not very meaningful or memorable • Solution… • A meaningful project in which the students have a vested interest
Serving Through Statistics CAMT 2012 II.B. The Concept of Service-Learning Service-Learning connects service to the community with academically-based learning.
Serving Through Statistics CAMT 2012 II.C. Putting it into Practice • National Service-Learning Clearinghouse • www.servicelearning.org • Mathematics Resources • Introduction to Statistics Syllabus • Mark C. Hampton, University of Utah, 1995 • Service component options include working with a non-profit service agency which requires survey research for program evaluation or client needs assessment
Serving Through Statistics CAMT 2012 III. Implementation • The Idea • Student Organization • The Proposal • The Process Unfolding • Outside Consultants • Final Presentation and Publication • Grading
Serving Through Statistics CAMT 2012 III.A. The Idea • Teacher: • How can we apply the concepts learned in AP Statistics to benefit our local community/service agencies? • My Students: • Was Grimes County as effective at meeting the needs of wildfire victims as compared to volunteer organizations? What kind of help was given and how effective was it?
Serving Through Statistics CAMT 2012 III.B. Student Organization The teacher acts as a consulting facilitator outside of the direct chain of command
Serving Through Statistics CAMT 2012 III.B. Student Organization An Alternate Model
Serving Through Statistics CAMT 2012 III.C. The Proposal • What? • A complete and succinct statement on the question that is to be answered • Why? • Students write out an argument for why the answer to the posed question is important • How? • Plan of action: developing a survey instrument, conducting survey, compiling and describing data, and analyzing data • When? • Proposed calendar with deadlines for each phase
Serving Through Statistics CAMT 2012 III.D. The Process Unfolding • Developing Committees • Gathering a Population • Developing and Piloting a Survey • Administering Survey/Gathering Data • Describing and Analyzing Data • Presentation of Results (details to come) • Weekly Manager Meetings
Serving Through Statistics CAMT 2012 III.E. Outside Consultants • Dr. JamisPerrett • Assistant Professor • Department of Statistics • Texas A&M University • Specialty: Experimental Design/AP Curriculum • Dr. Laura Stough • Associate Professor • Department of Educational Psychology • Texas A&M University • Specialty: Disaster Research
Serving Through Statistics CAMT 2012 III.F. Final Presentation and Publication
Serving Through Statistics CAMT 2012 III.G. Grading • Student Self Evaluation (20%) • More than just a statement on the grade they think they should get • Analysis on contributions with evidence and reflection on individual/group dynamic • Project Manager Evaluation (30%) • Written Summative Report (50%) • (Optional: Evaluations from Service Agency)
Serving Through Statistics CAMT 2012 IV. Reflections • What Went Well and Why • What Could be Improved and How • Keys to Success • Branching Out
Serving Through Statistics CAMT 2012 IV.A. What Went Well and Why • Student Interest was Piqued • Topic was personal and chosen by students • Professionalism was Improved • Comfort levels were stretched through community interaction and survey • Importance of Statistics was Cemented • Real life scenario with real people • The “Aha Moment” was Achieved • Deep connections were drawn from course material to project implementation
Serving Through Statistics CAMT 2012 IV.B. What Could be Improved and How • Equal Involvement • Grading Incrementally • Modification of Group Structures • Stricter Deadline Enforcement at the Intermediate Levels • Grading Incrementally • Completion through Proposal Phase in Fall
Serving Through Statistics CAMT 2012 IV.C. Keys to Success • The Power of Choice • Vested interest in the topic • Keeping it Local • Meaningful application • Commitment to Public Presentation • Obligation is to the community, not just a grade • Required Reflection Beyond Calculations • Students chose the topic so they have to defend why it matters
Serving Through Statistics CAMT 2012 IV.D. Branching Out • http://www.edutopia.org/project-based-learning • Geometry • Architectural Design (for Service Organization) • Algebra II/Pre-Cal • Modeling (for Service Organization) • Calculus • Optimization (for Service Organization)
Serving Through Statistics CAMT 2012 V. Resources • Mathematics Resources Page for the National Service-Learning Clearinghouse • http://www.servicelearning.org/instant_info/fact_sheets/he_facts/math_he • Issue of PRIMUS Dedicated to Successful Service Learning Resources • http://www.tandfonline.com/toc/upri20/current • ASA Student Project Competition • http://www.amstat.org/education/posterprojects/index.cfm • Complete Description of This Specific Project with Links to Student Publication • http://www.GodandMath.com
Serving Through Statistics CAMT 2012 VI. Q & A